
Tour of Wireglass
Wireglass has two halves that share the same settings, history and look: a client to run things, and a DevTools panel to watch what a page does. A few things, like themes and shortcuts, apply everywhere. Every card below links to its guide, and most come with a narrated video.
New here? Run your first query · 2:15 videoThe client
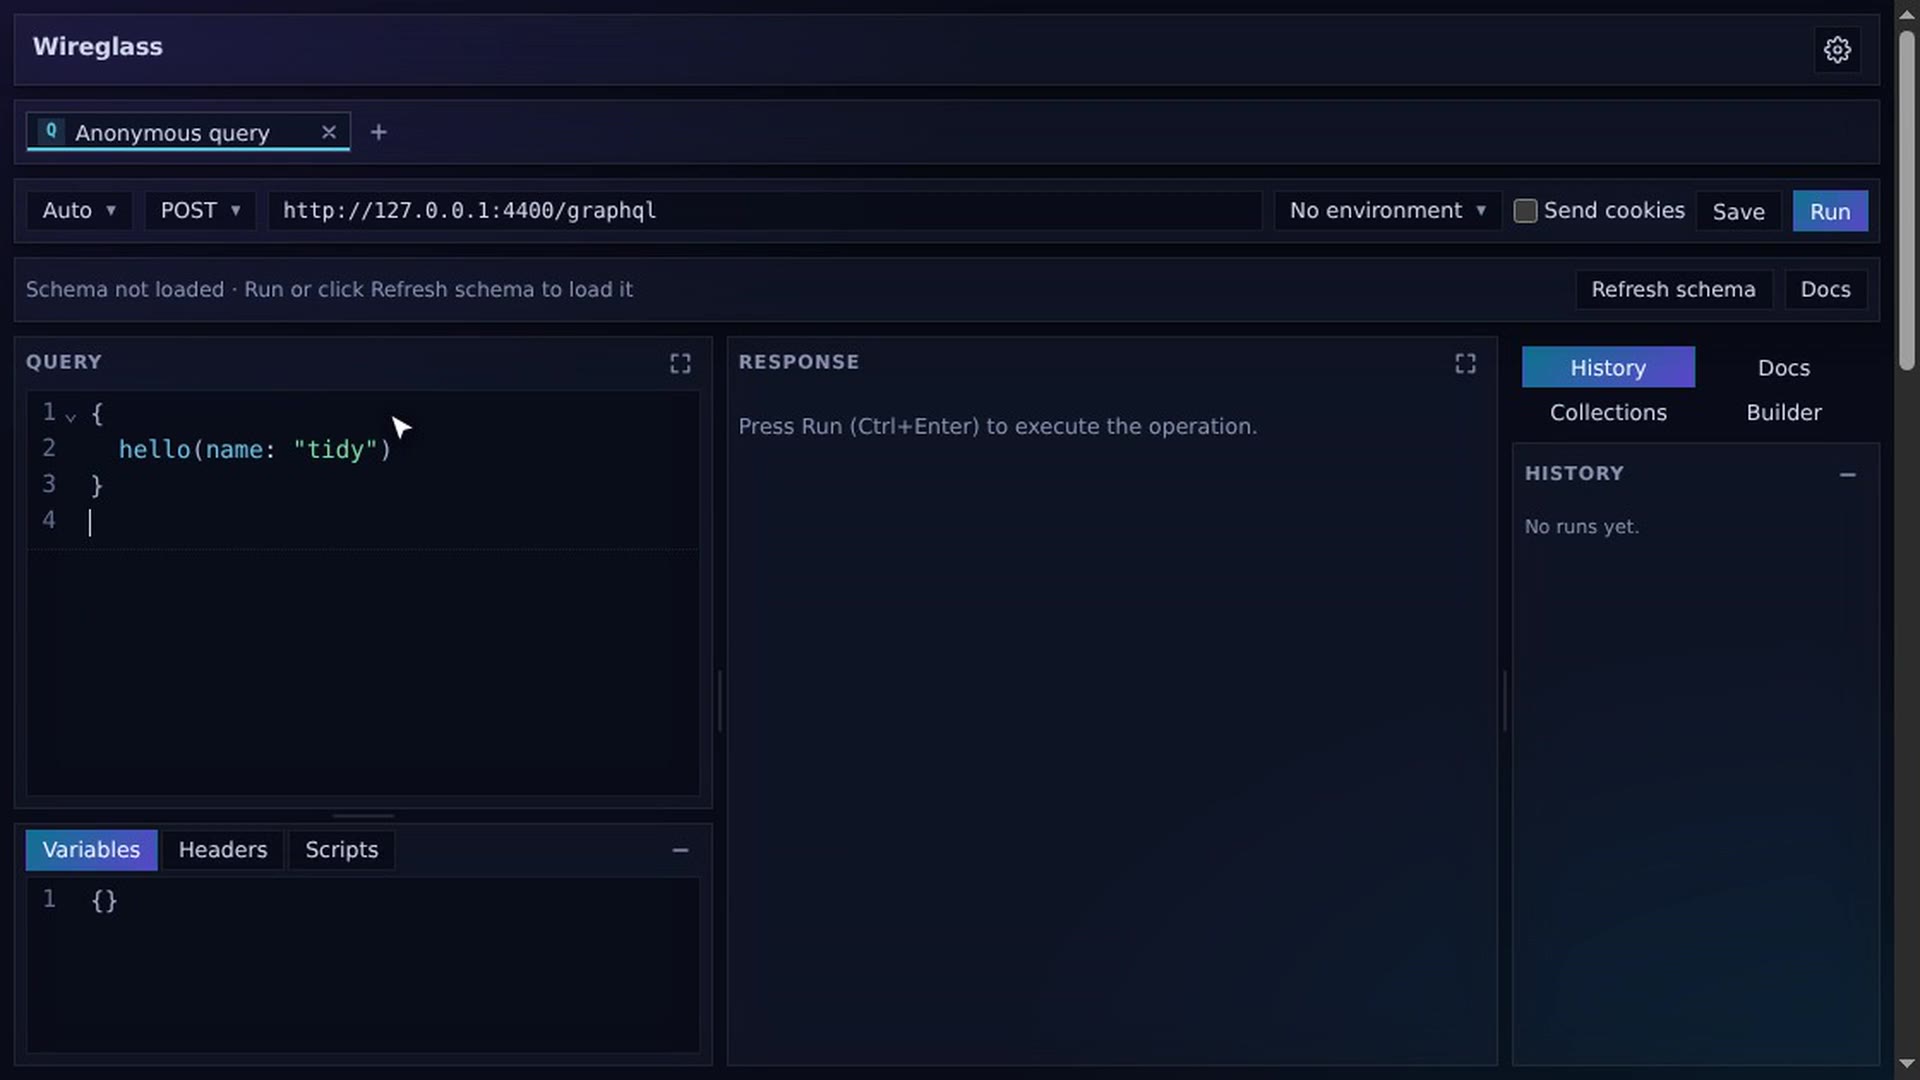
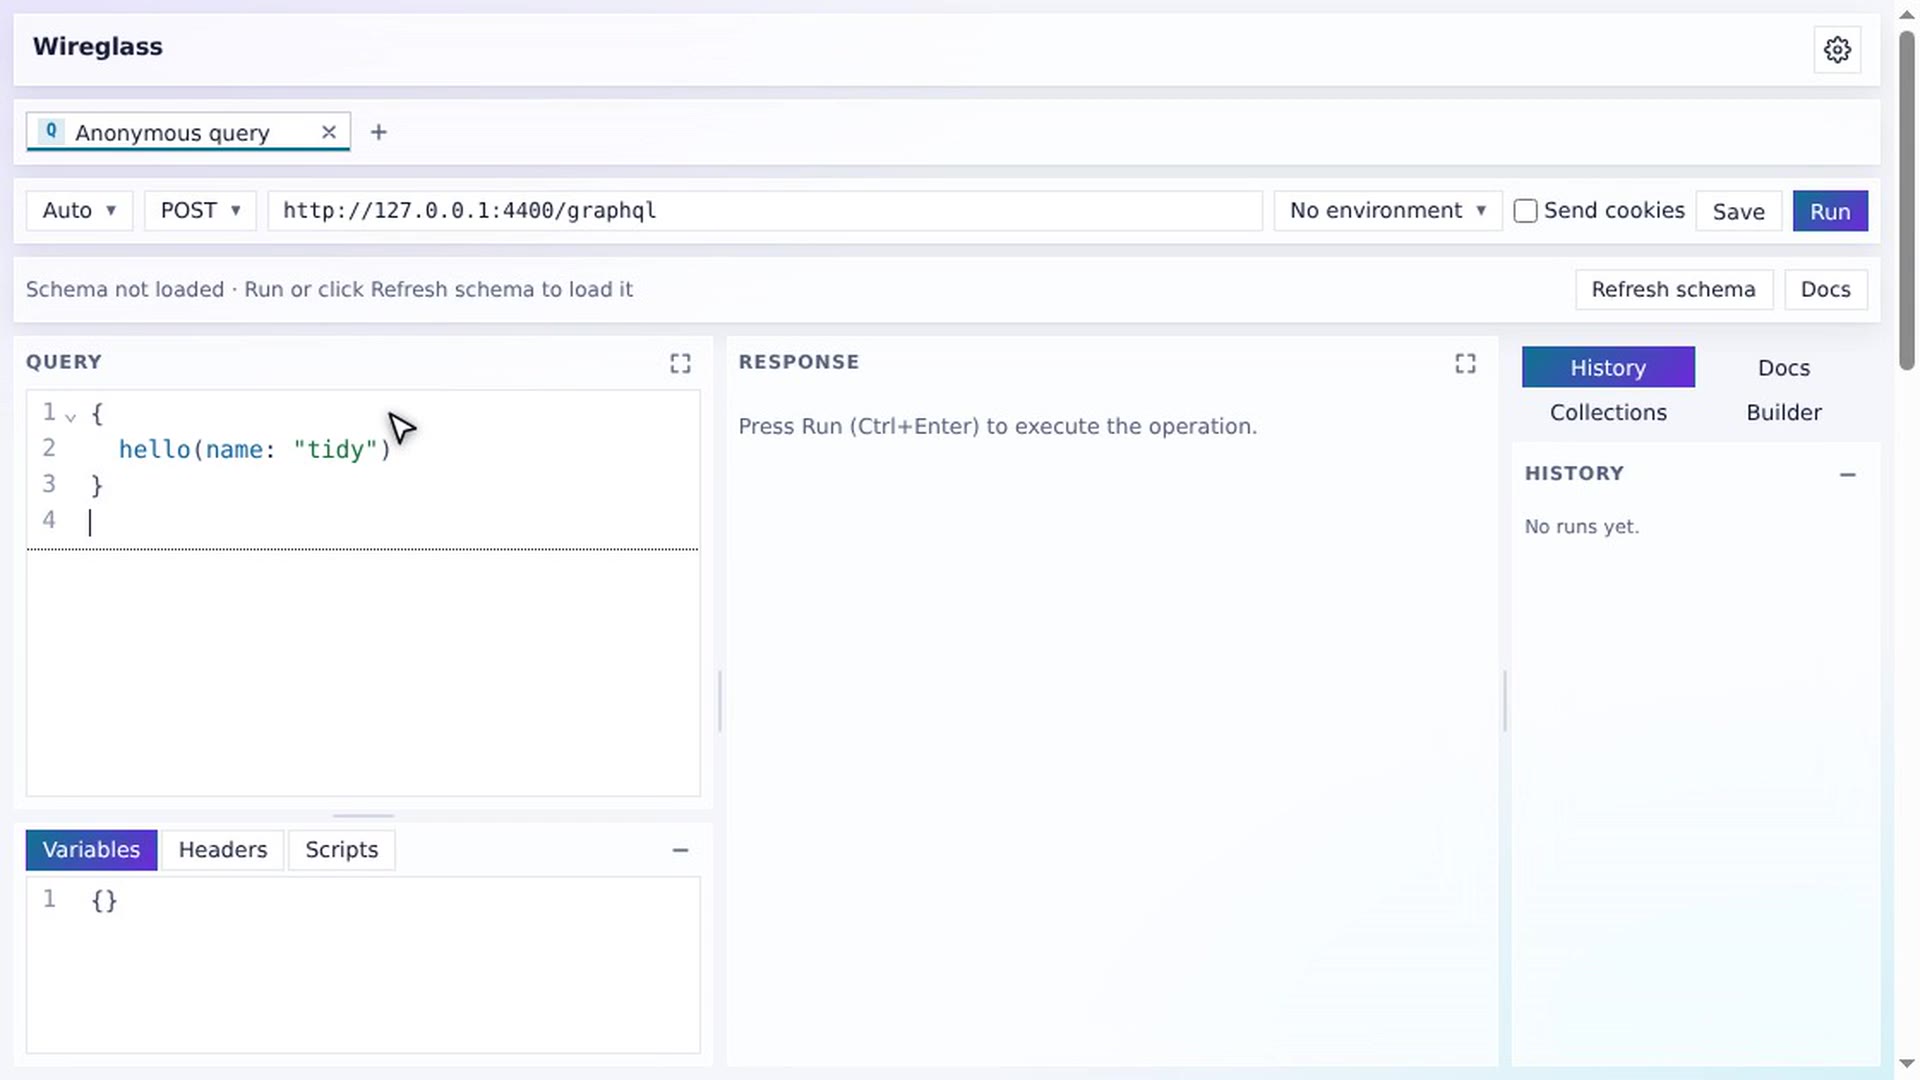
A full-tab GraphQL client, also inside DevTools. This is where you run things.
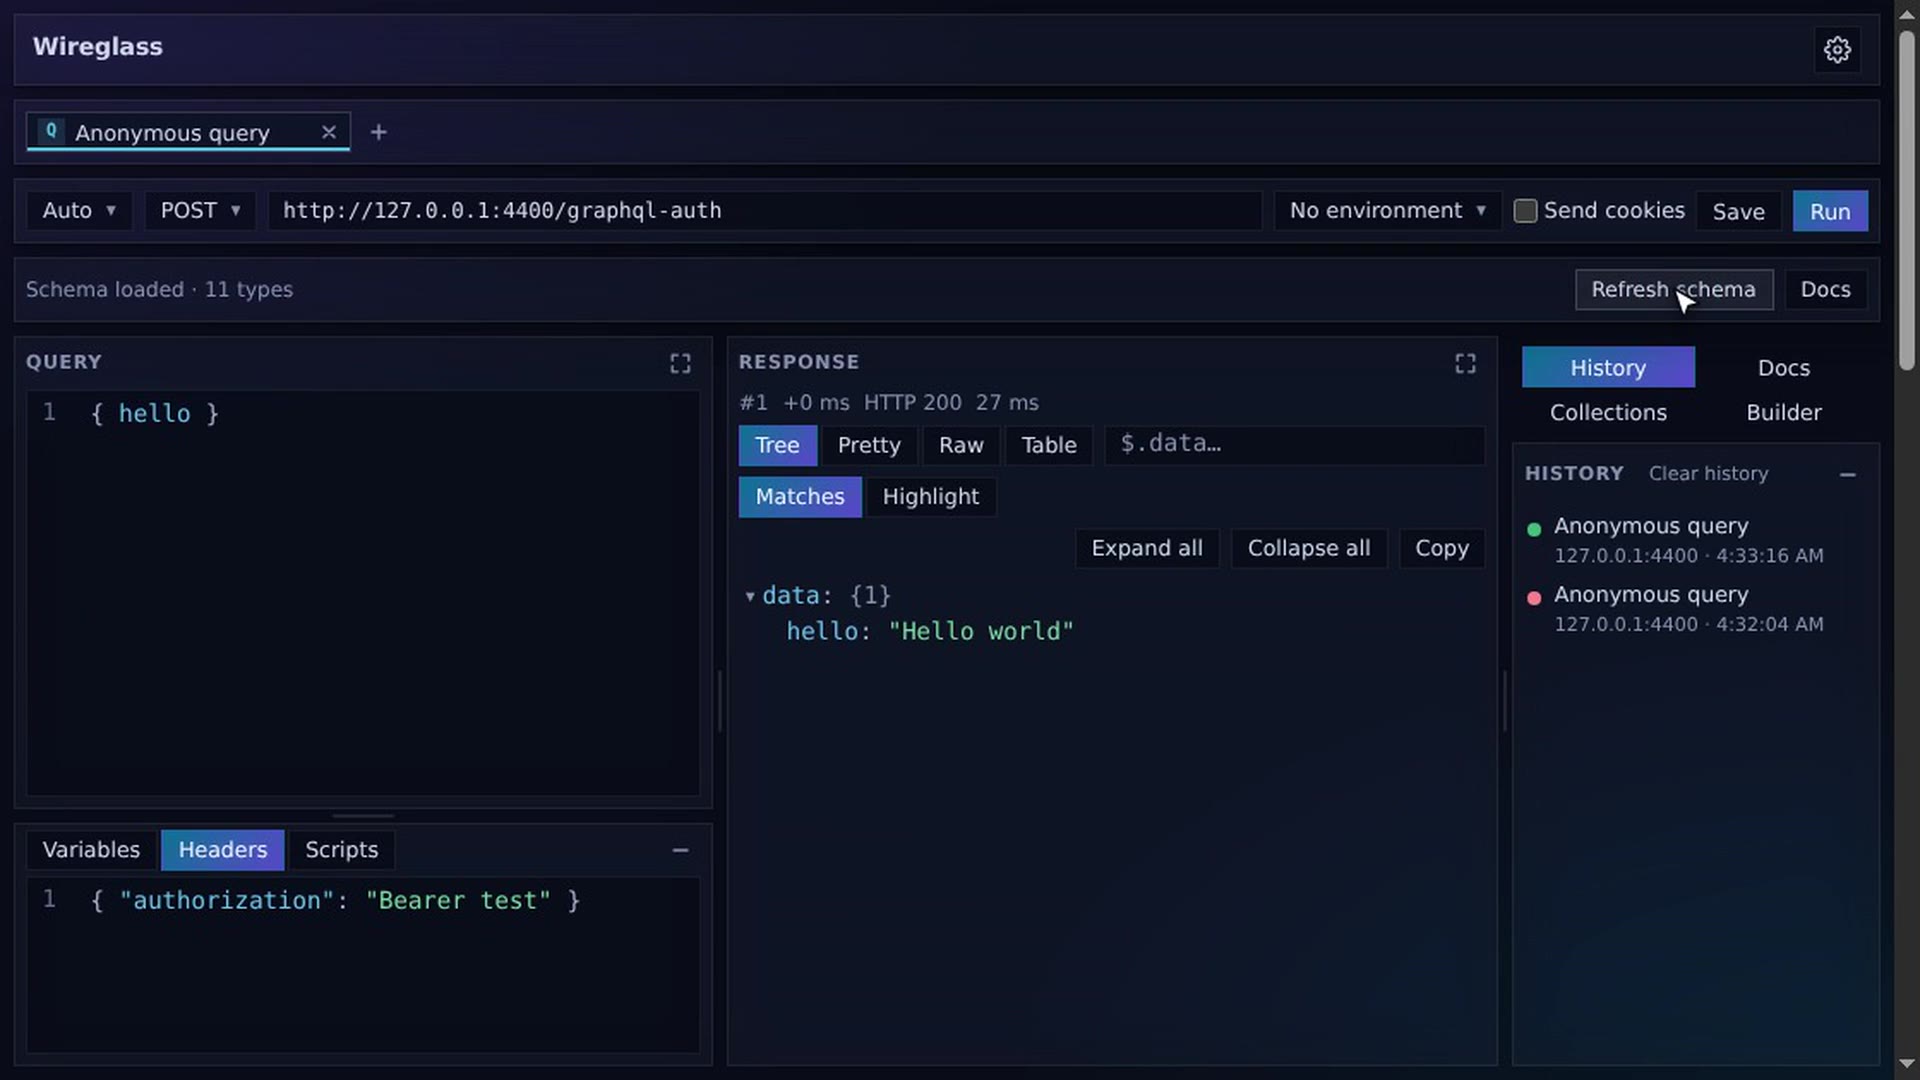
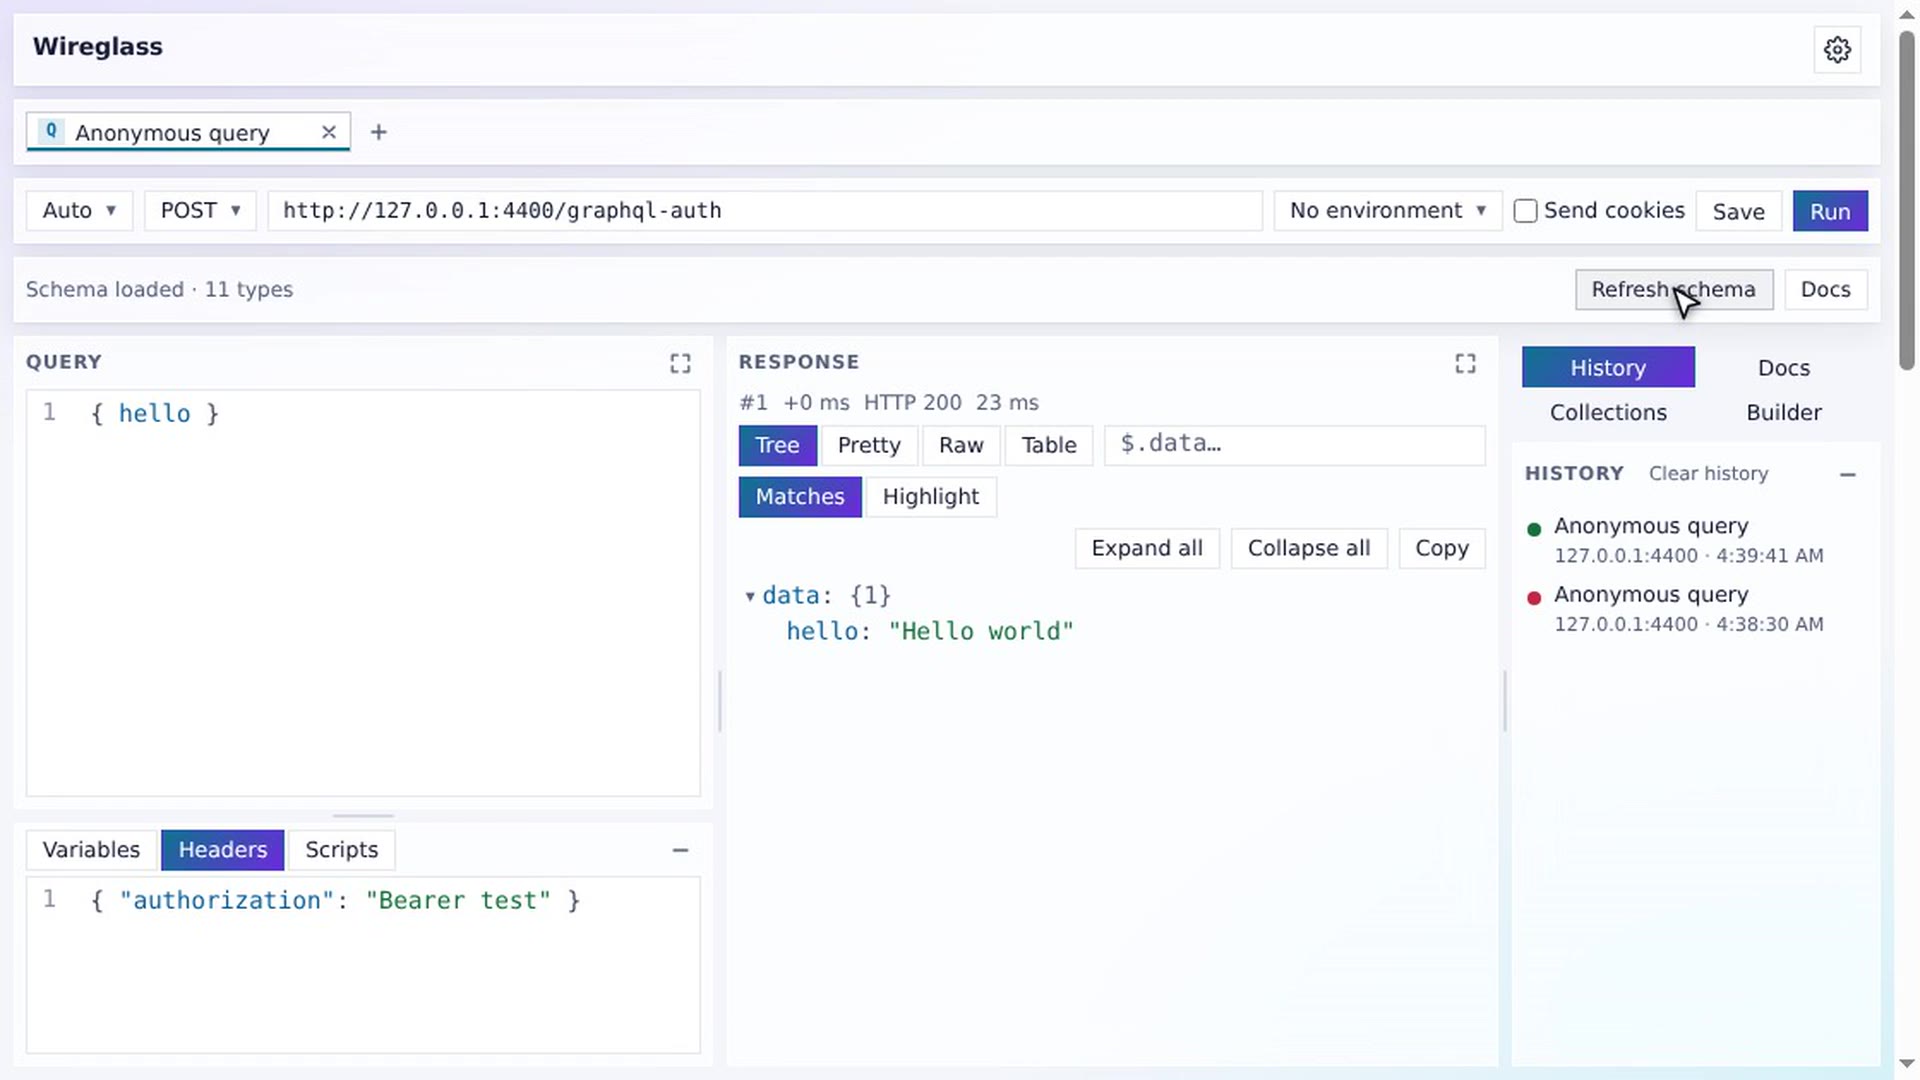 2:57Schema and docsIntrospect on request, cache per endpoint, autocomplete, lint and browse the docs.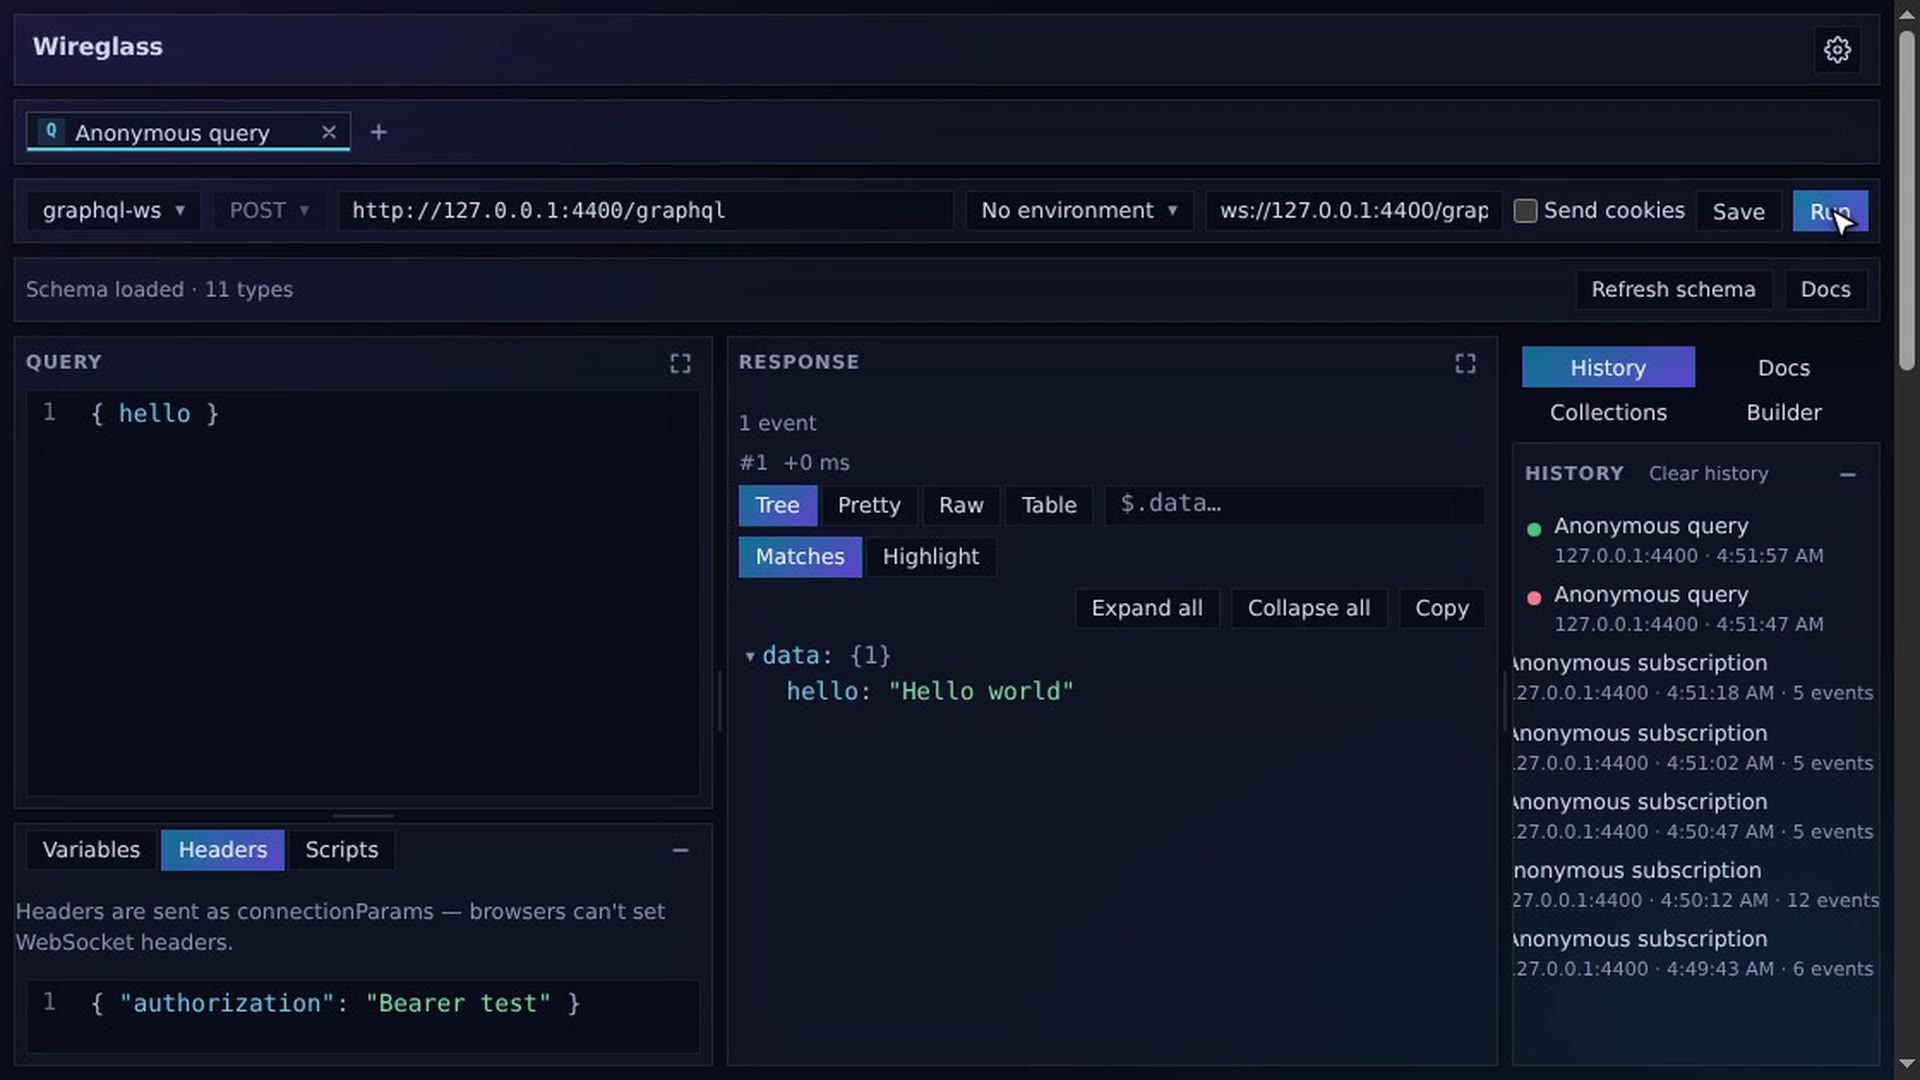
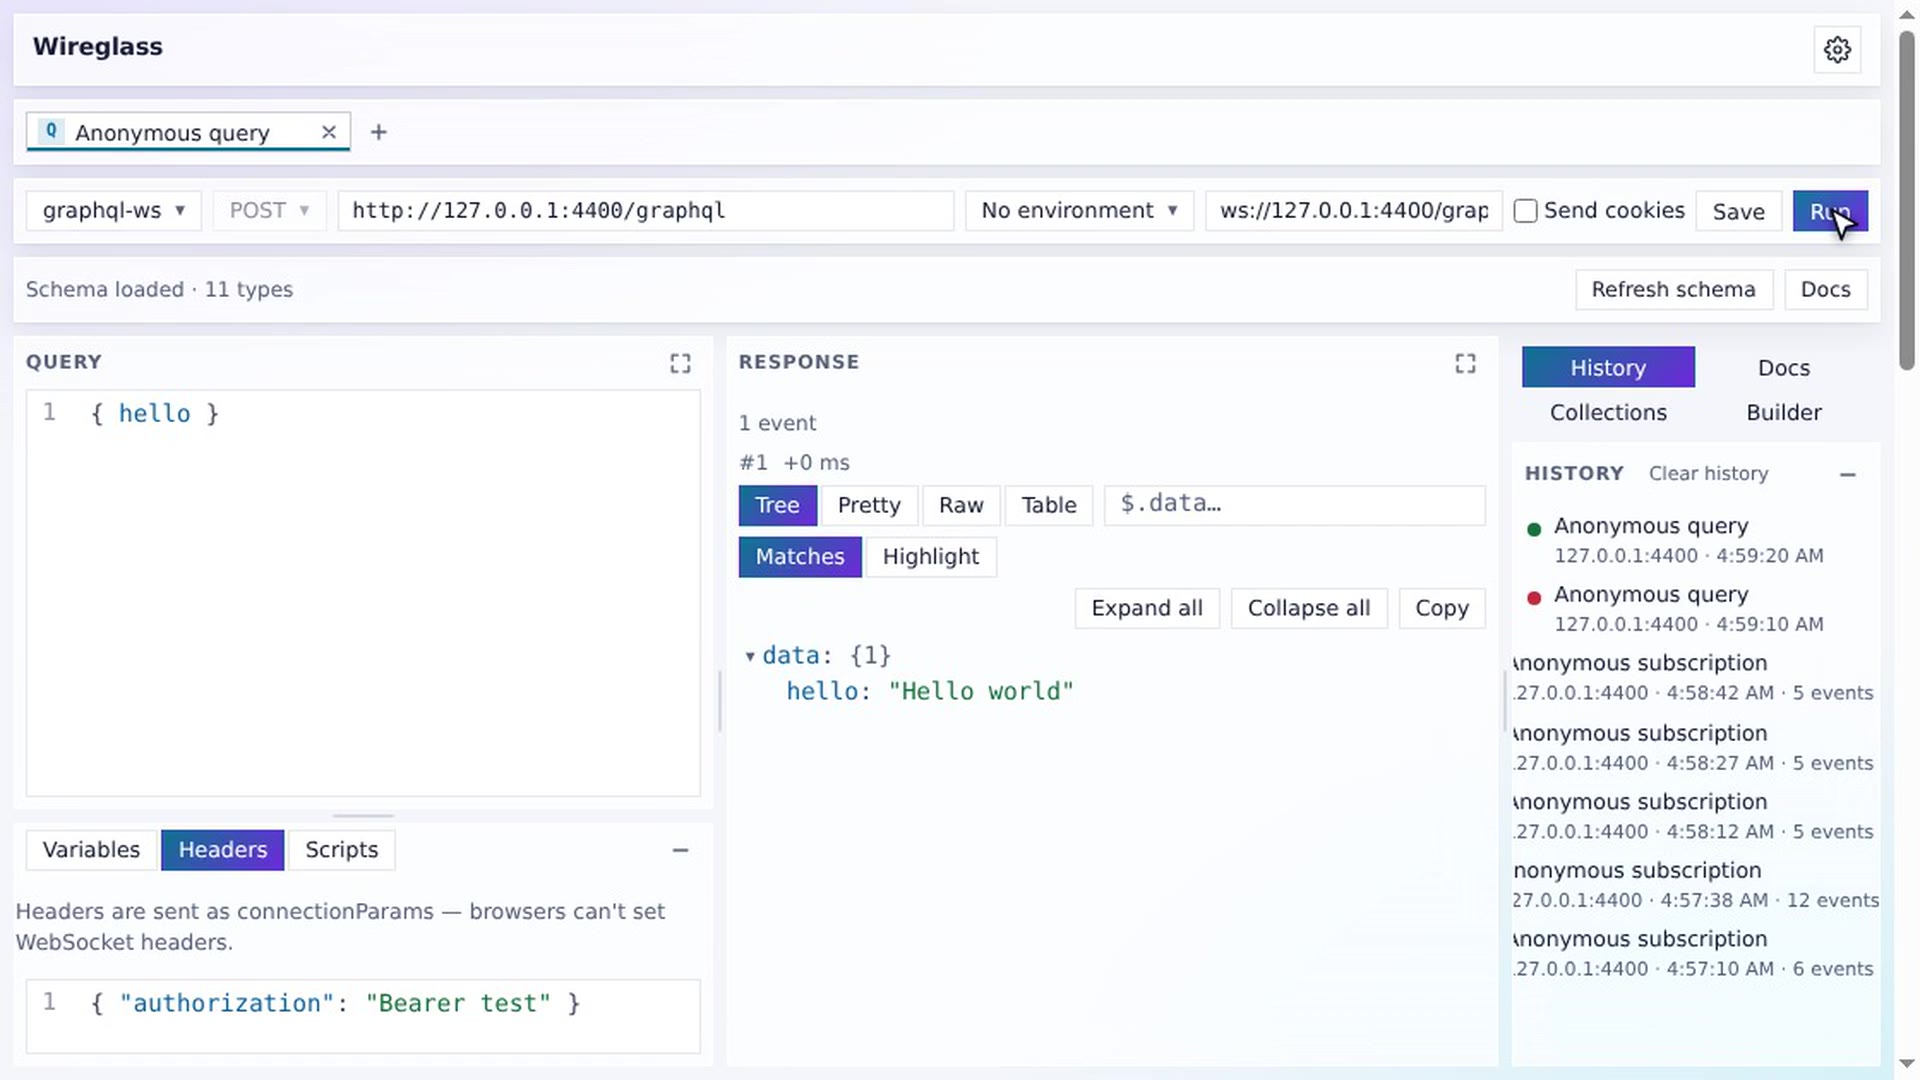 3:22Subscriptionsgraphql-ws, legacy WebSocket, SSE and multipart, with a live event log.
 2:58Response viewerTree, table, pretty and raw views, a JSONPath filter and an inspector.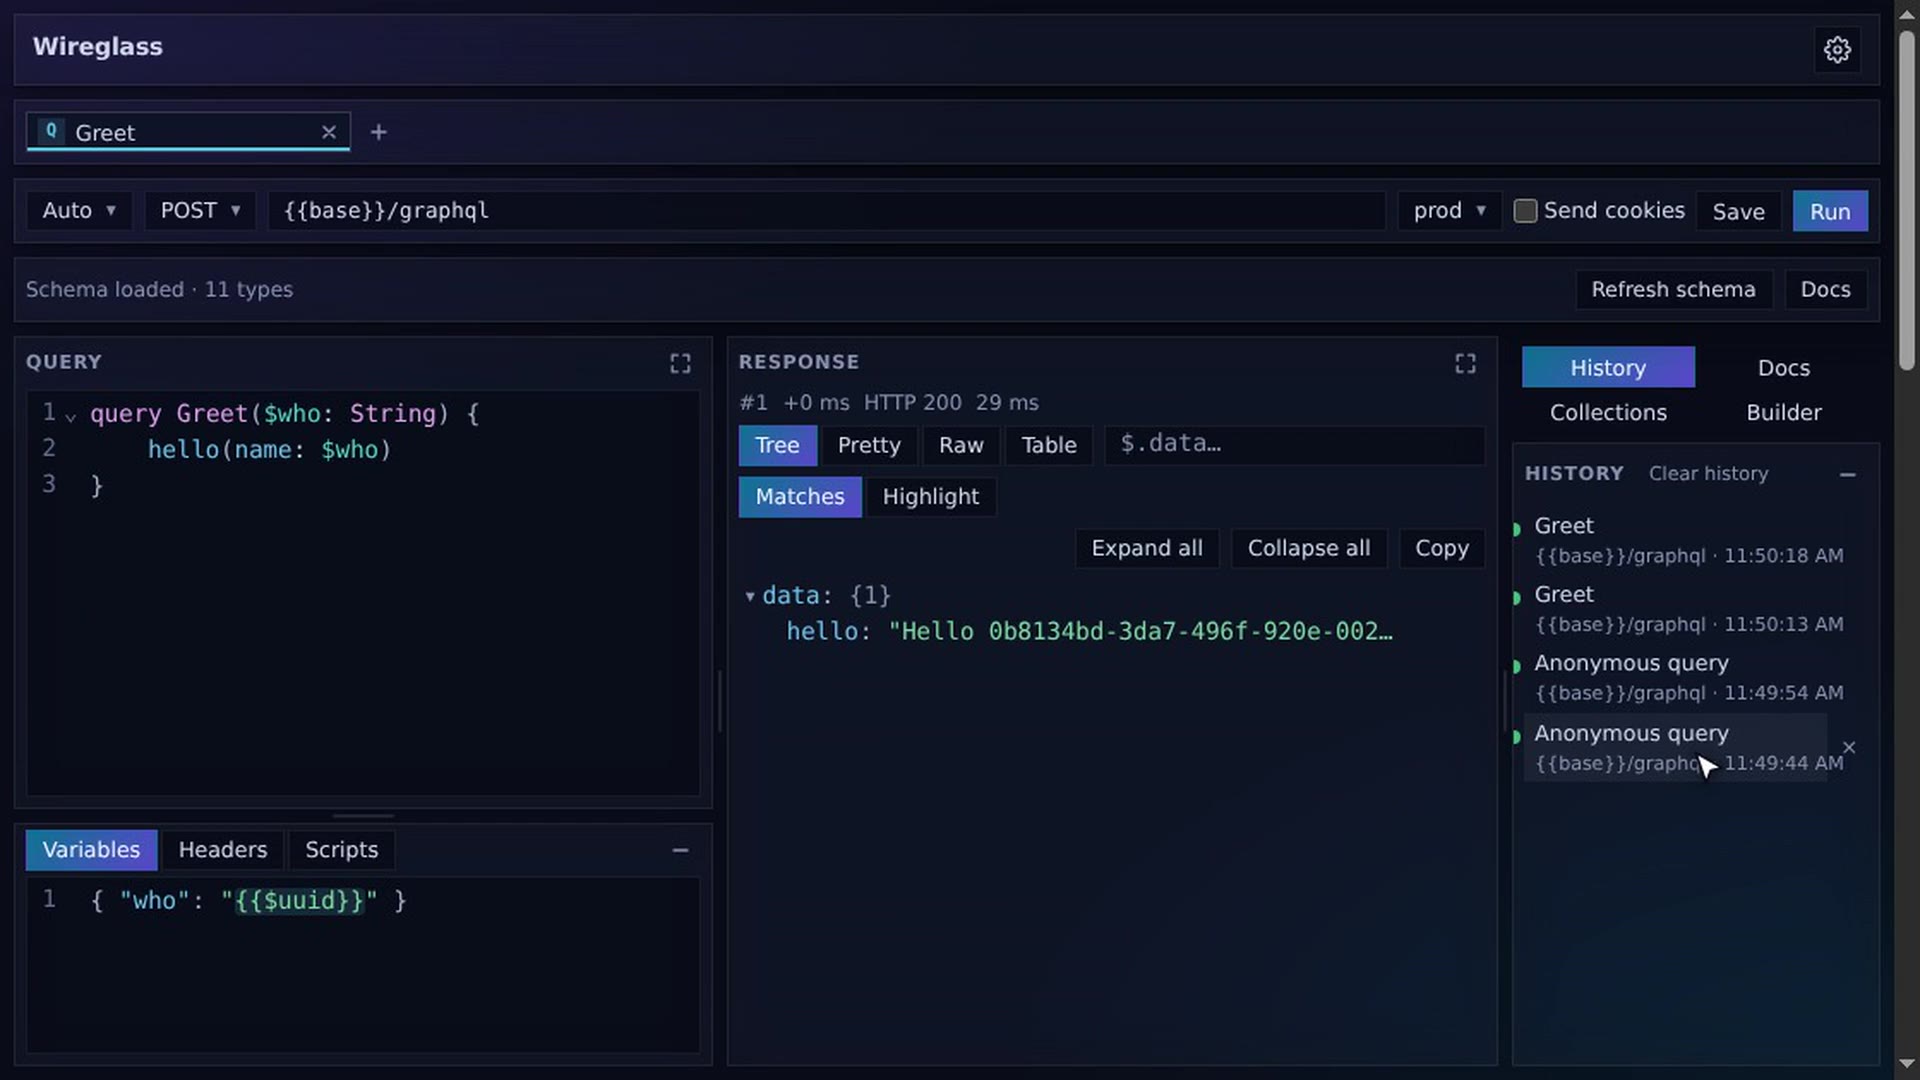
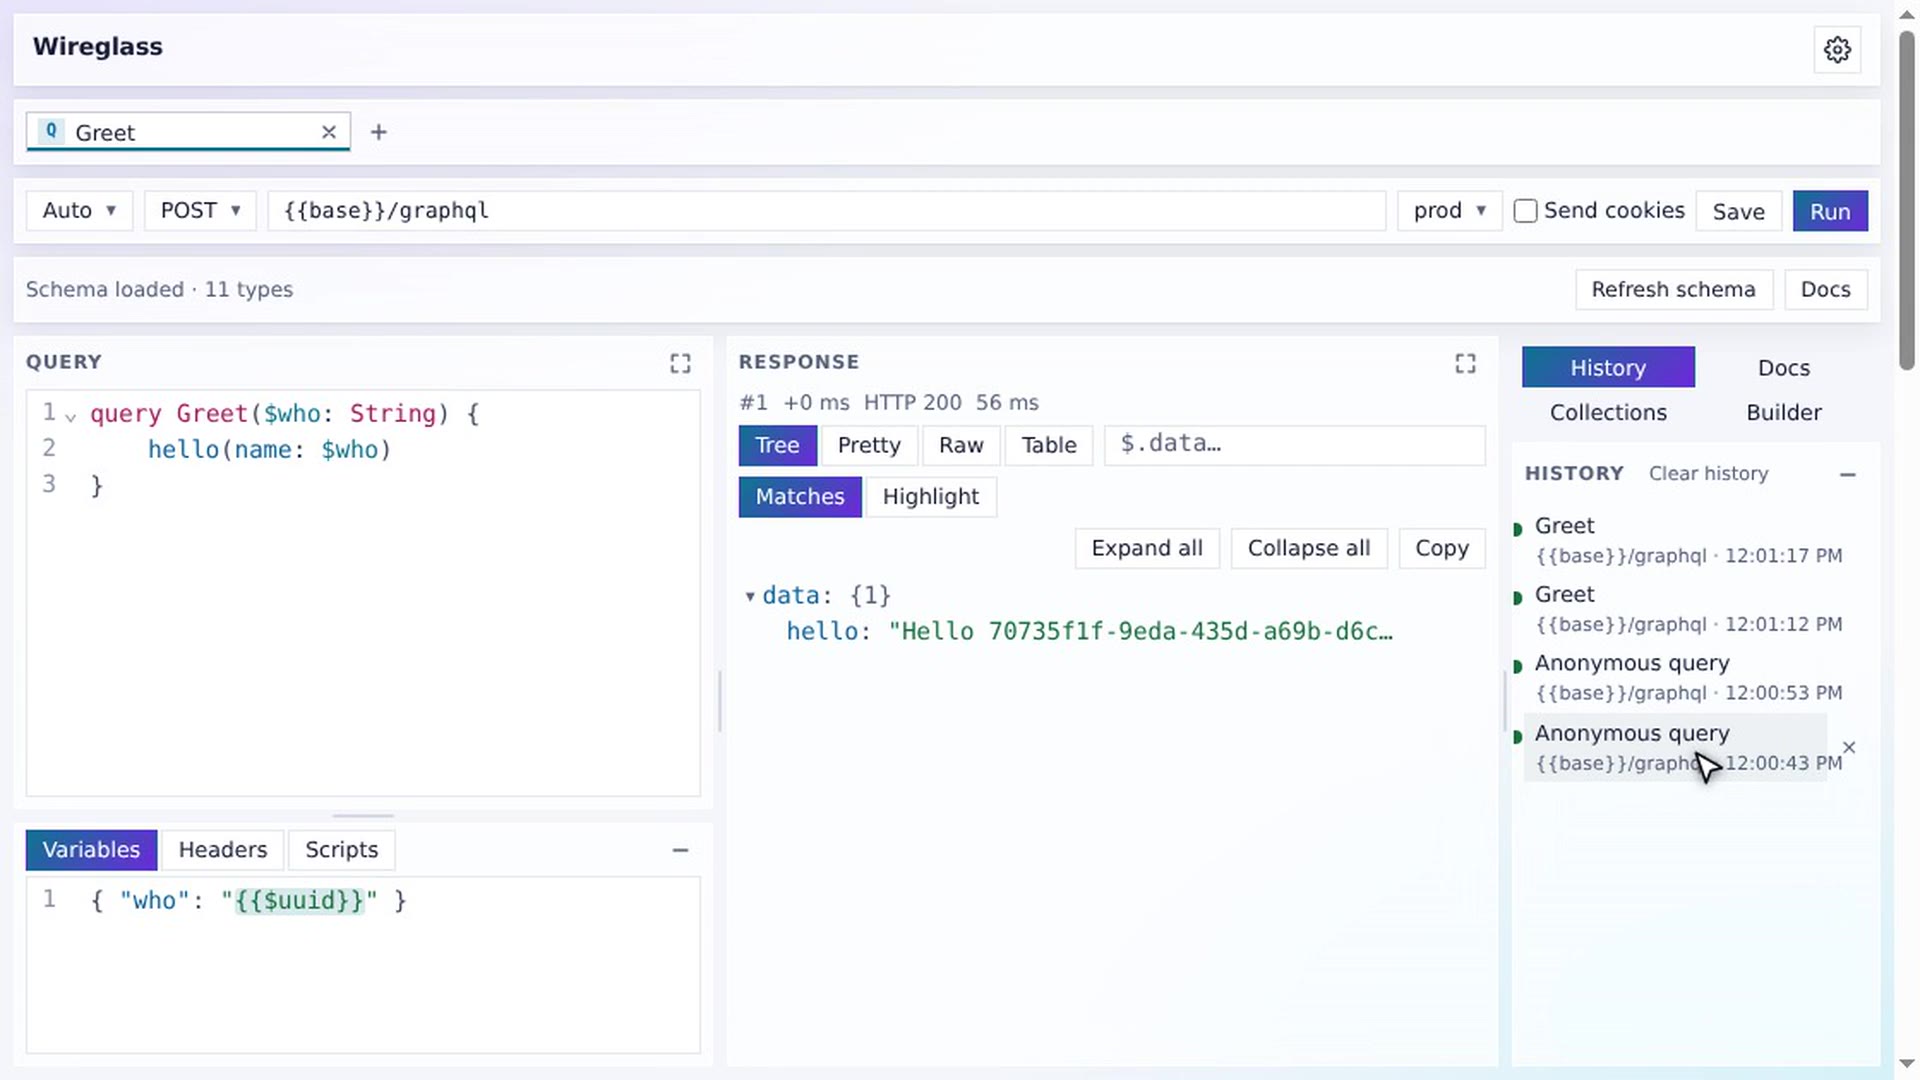 3:31EnvironmentsNamed variables with secrets, used as {{name}} in endpoints, headers and variables.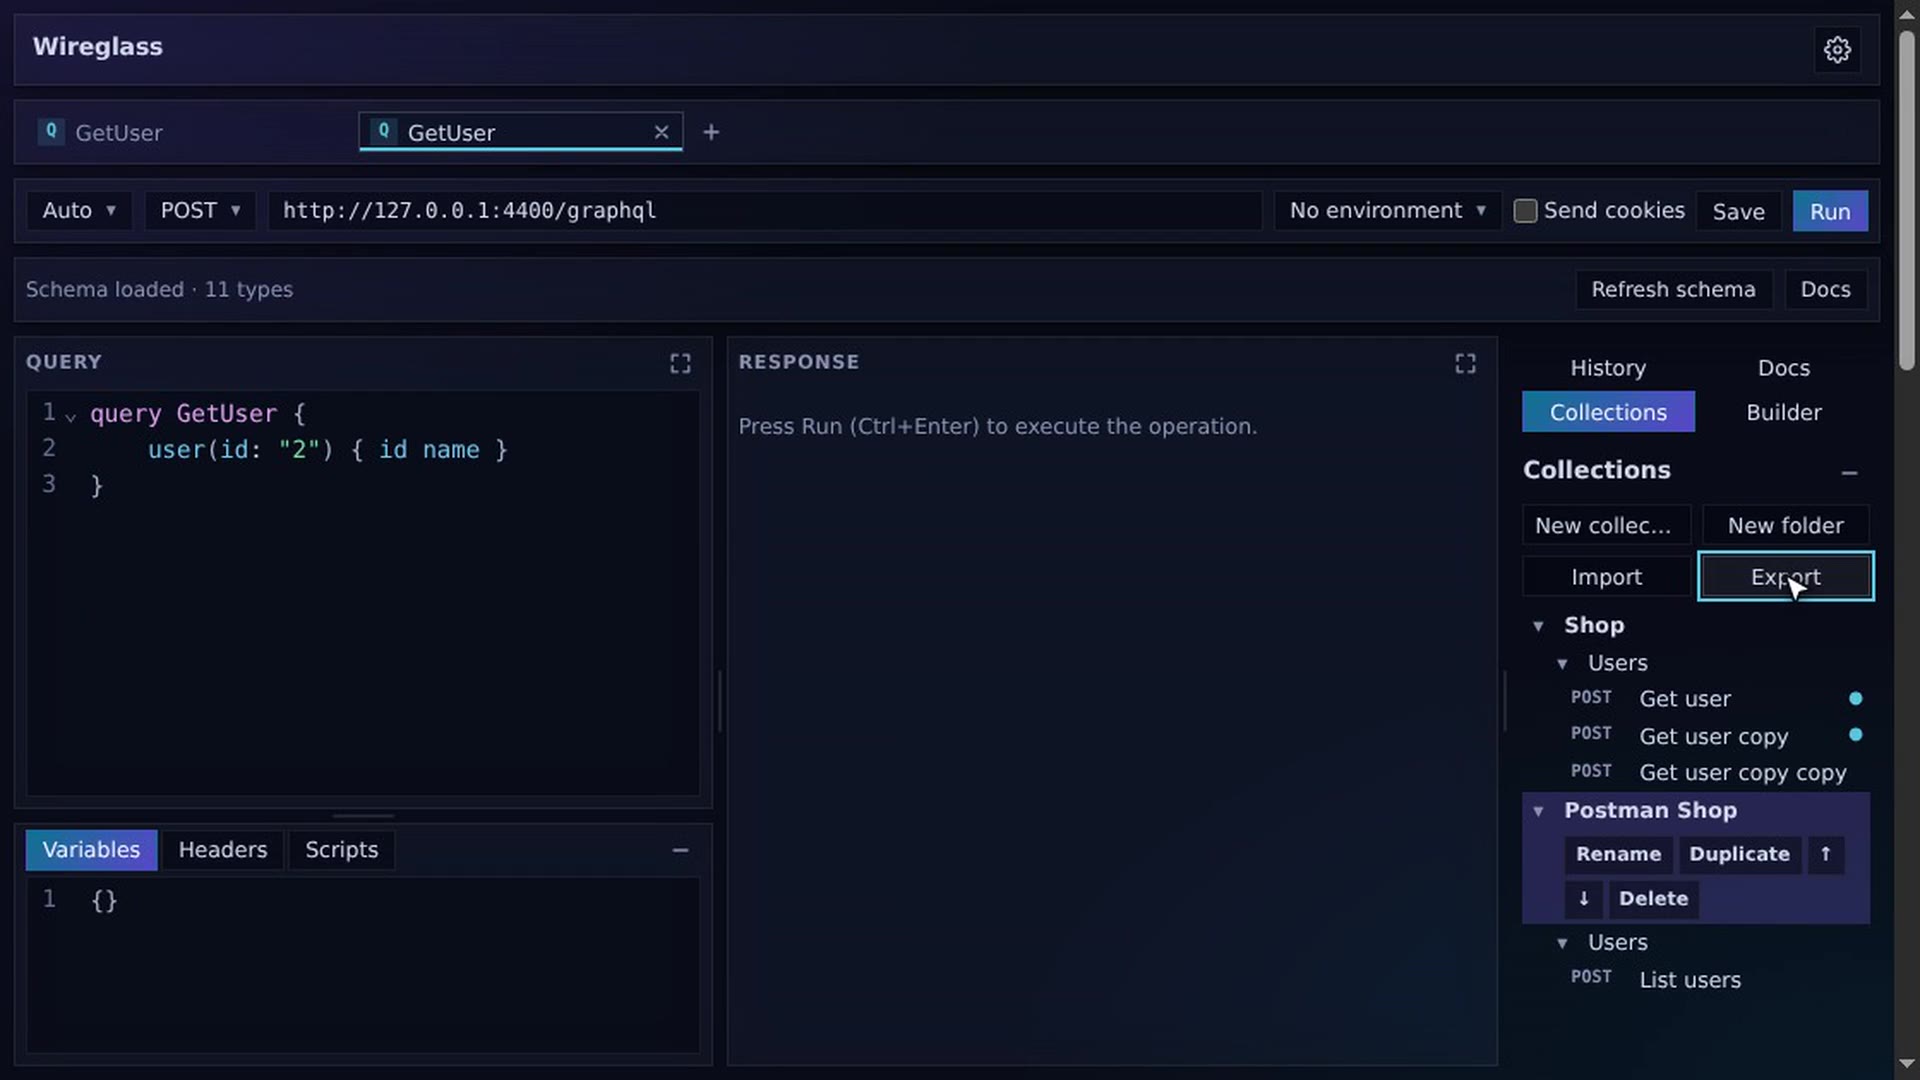
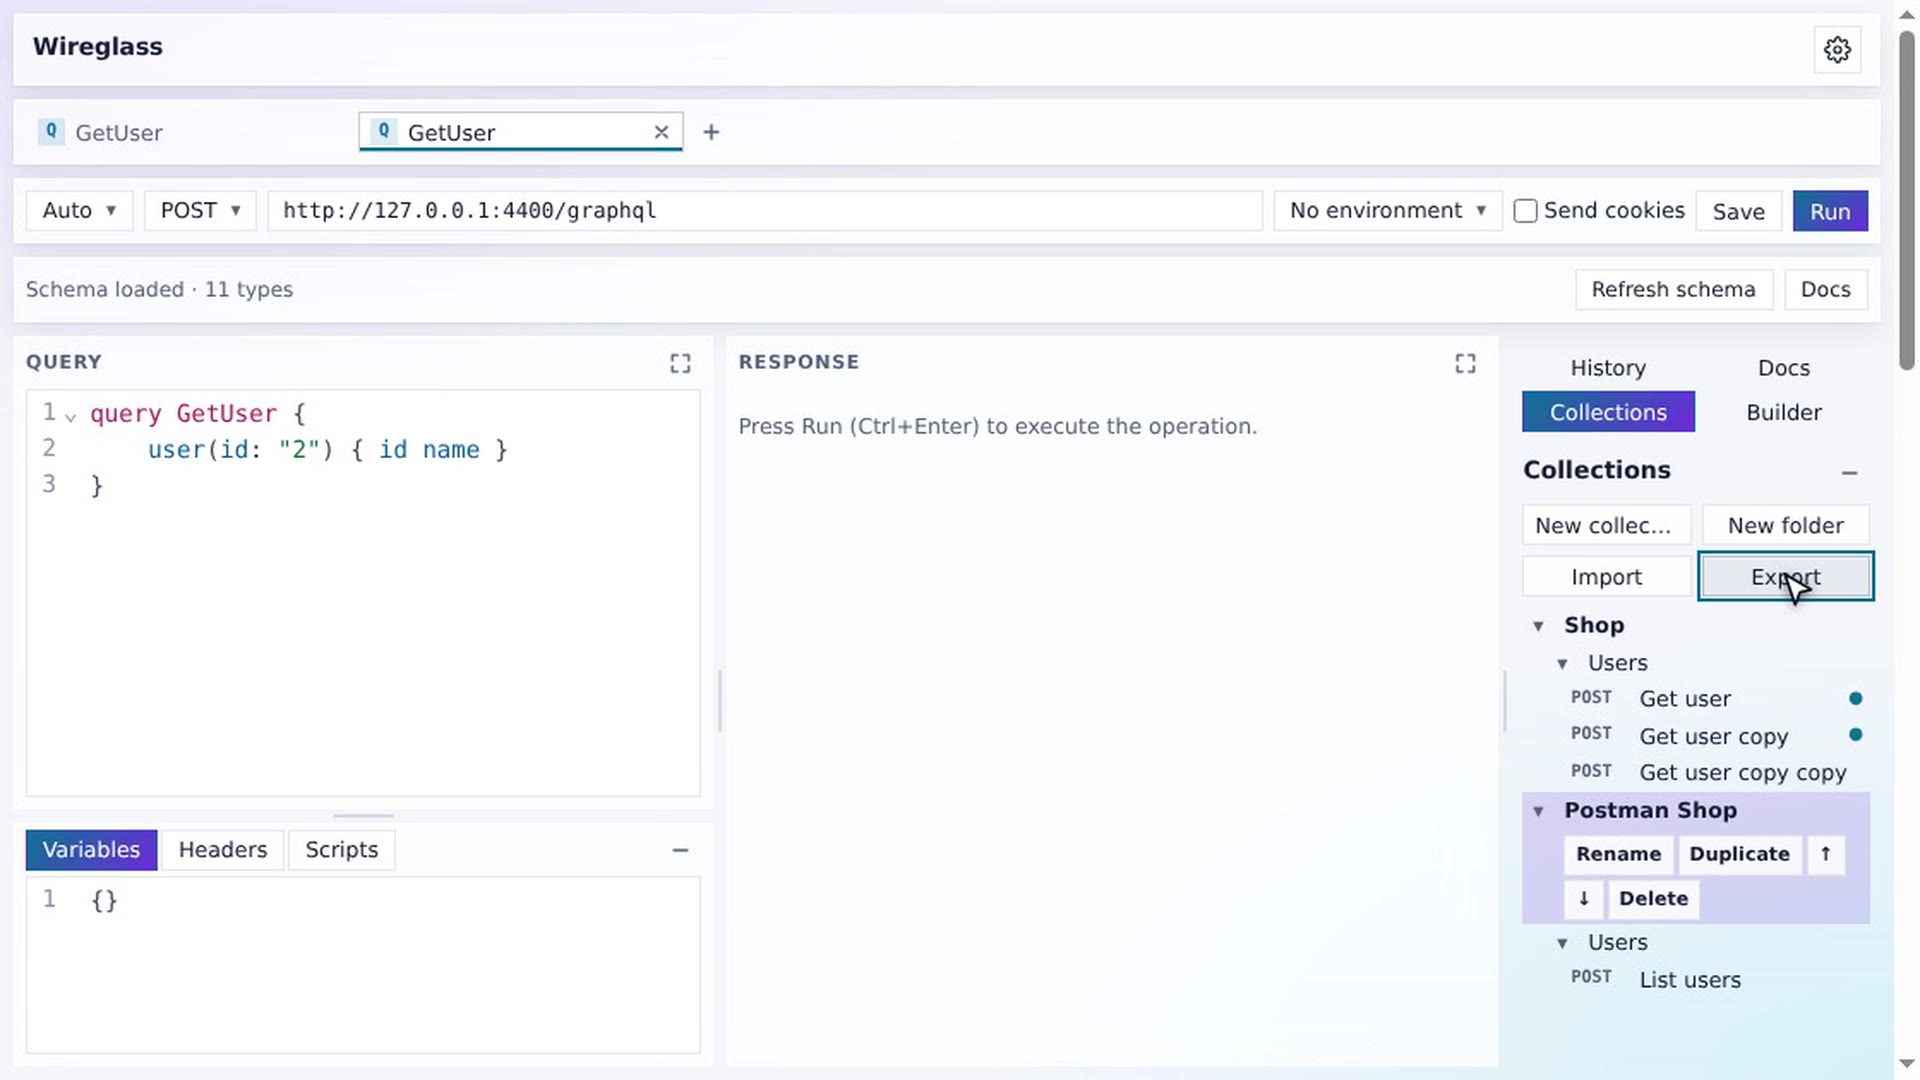 2:57CollectionsSaved requests in folders. Import from Postman and Insomnia.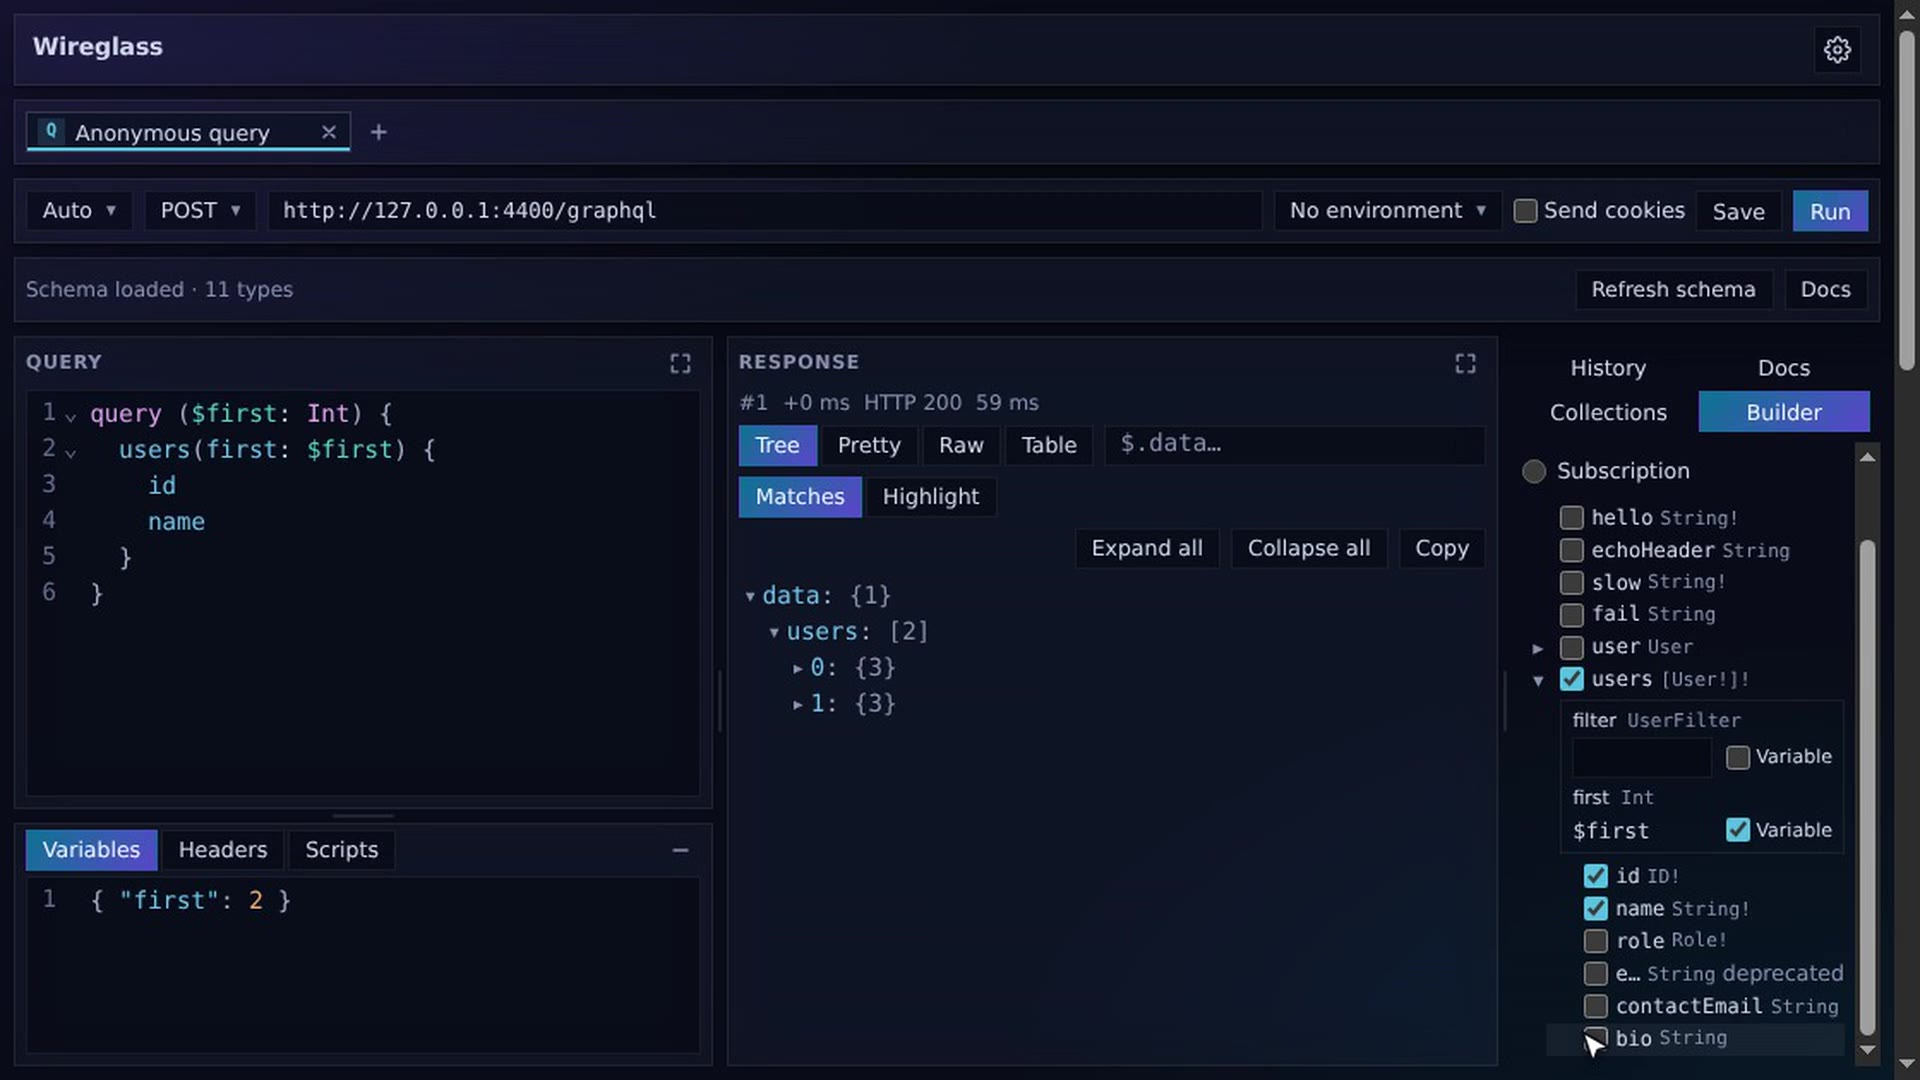
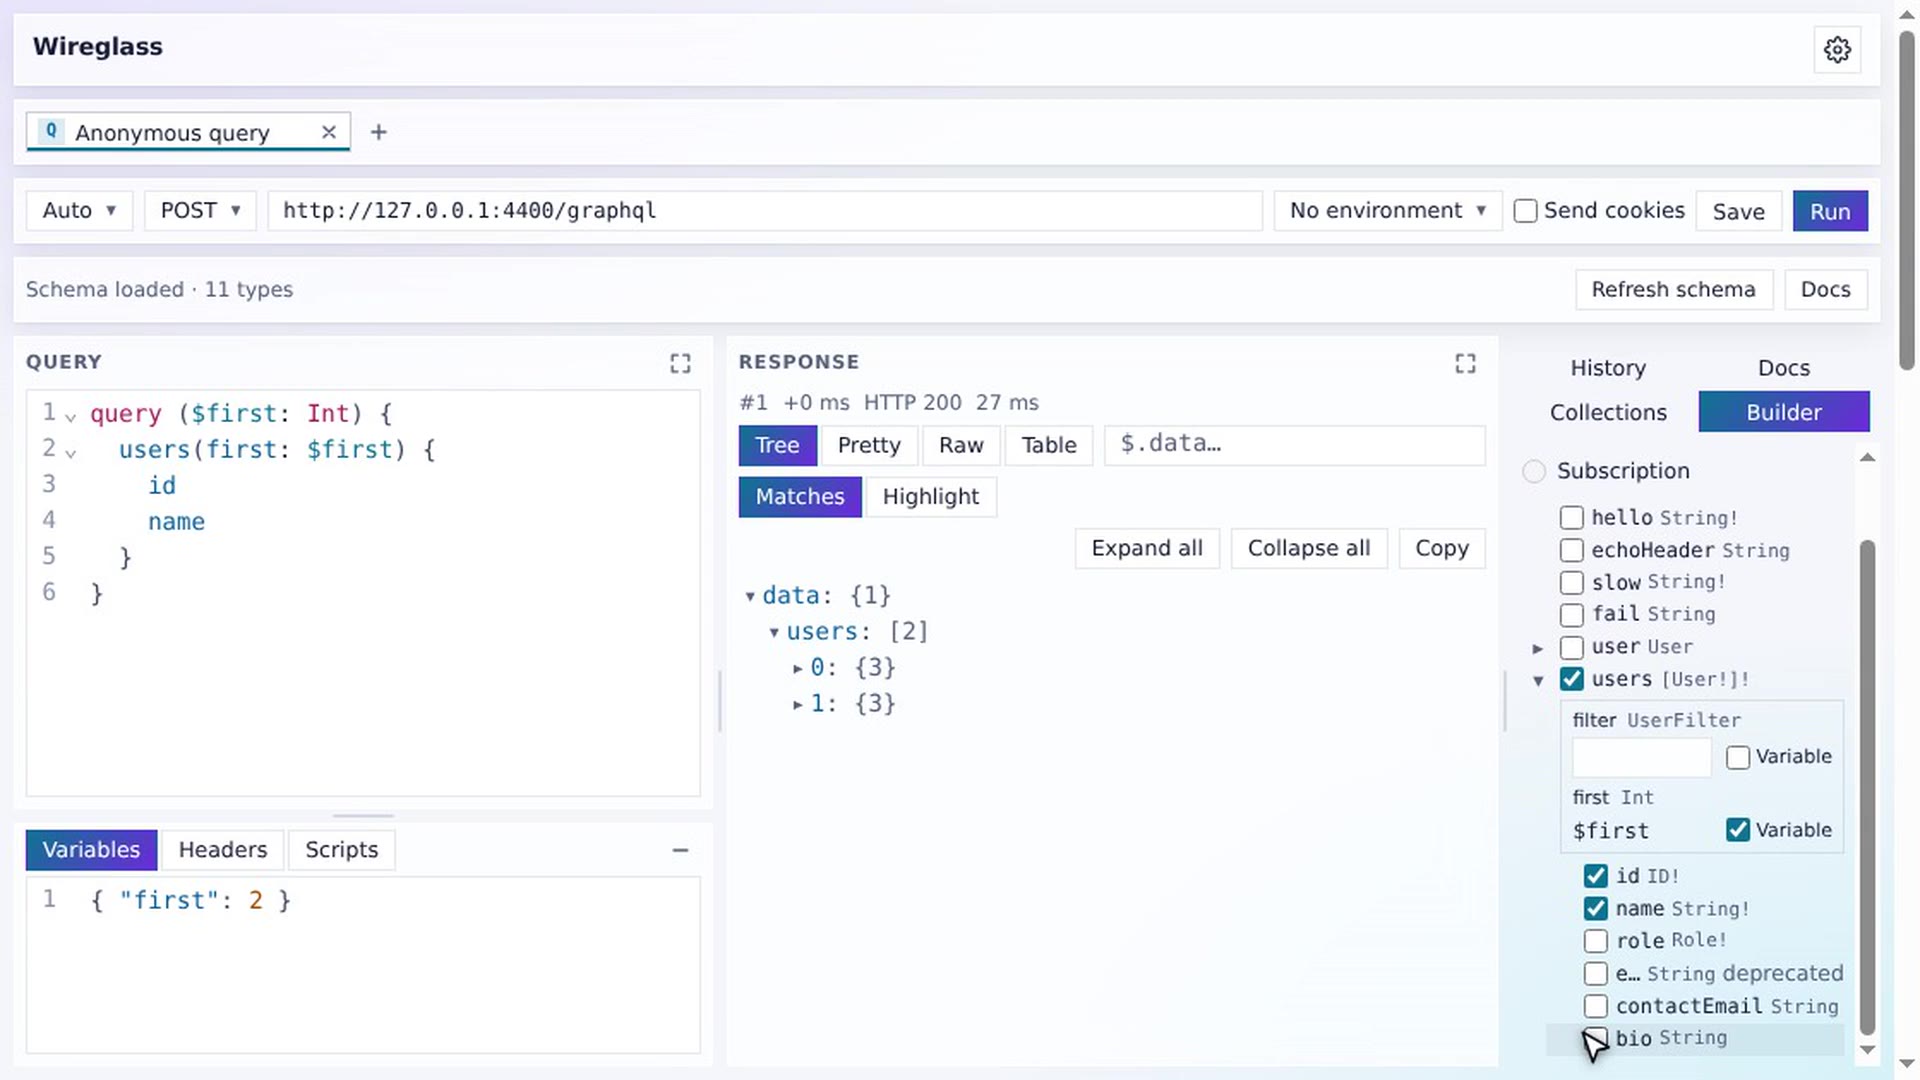 2:53Query builderCompose a query by ticking fields and arguments, with the editor in sync.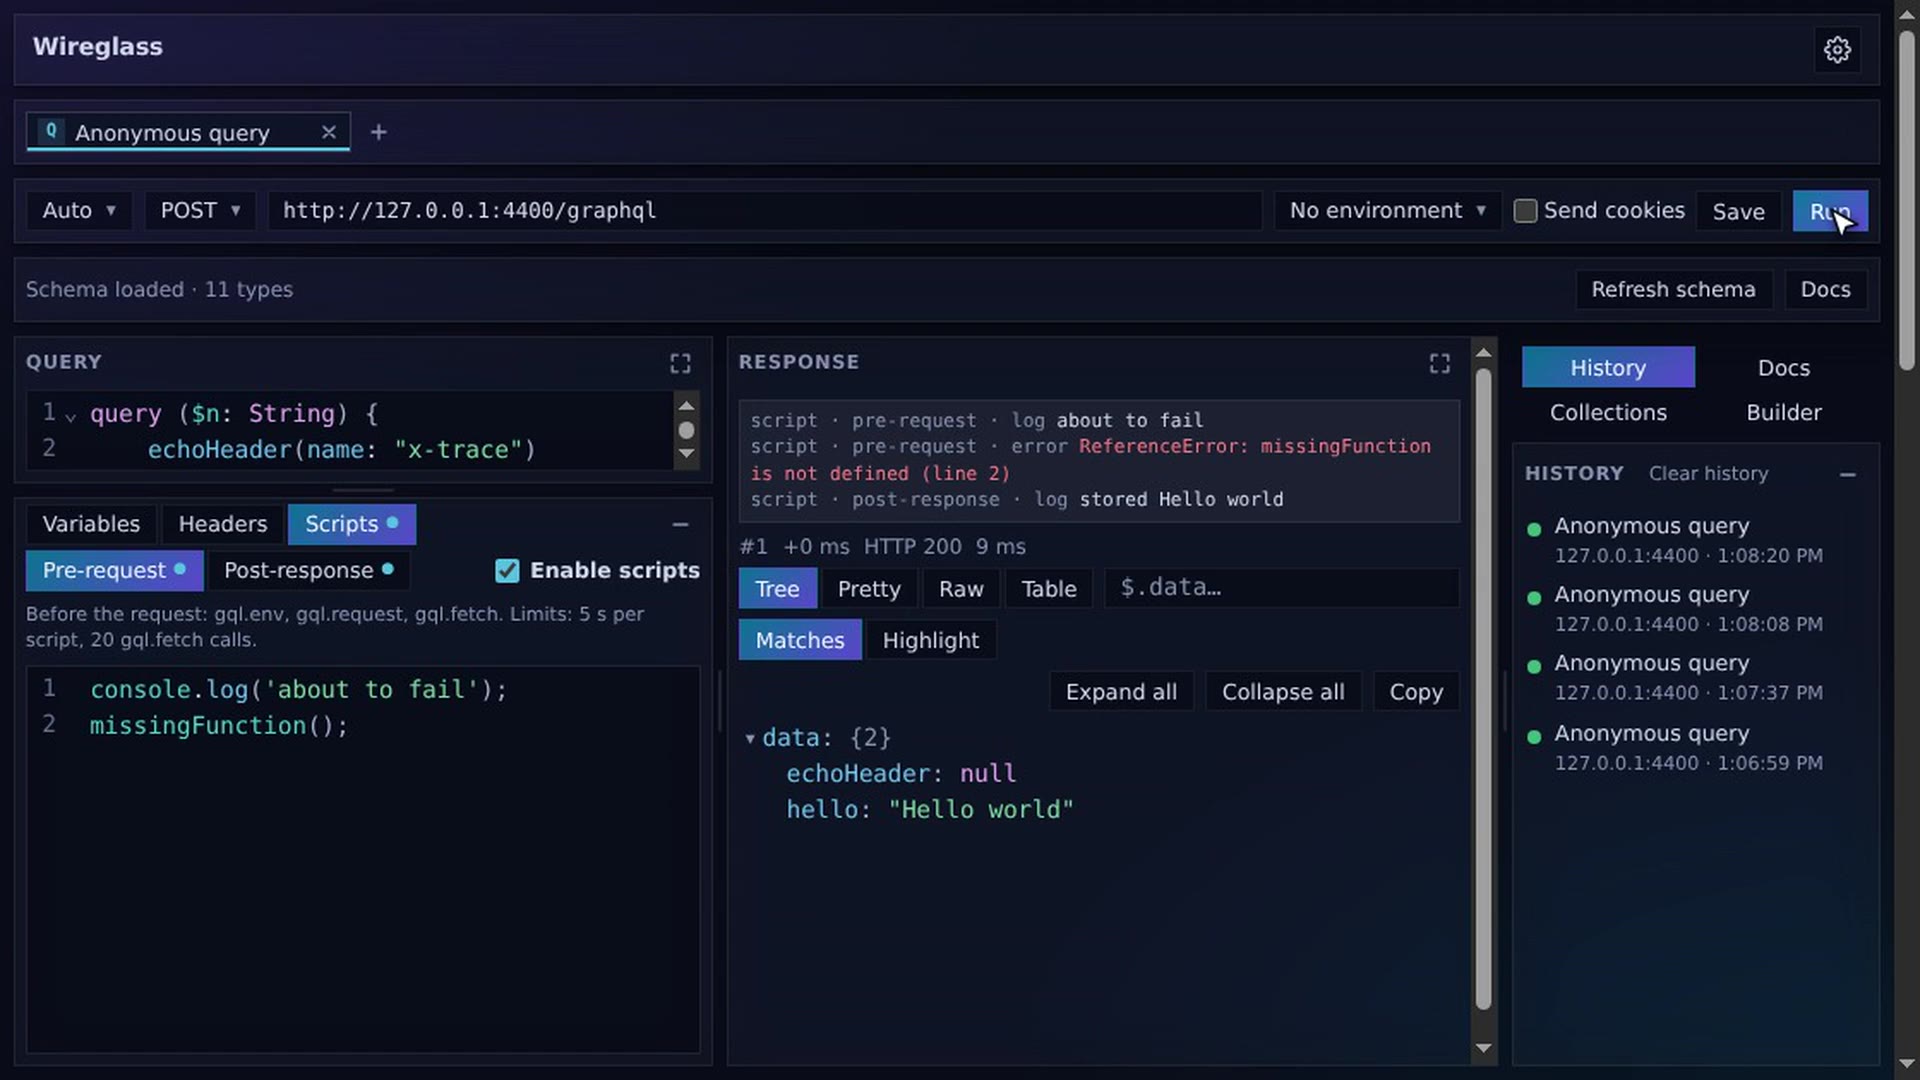
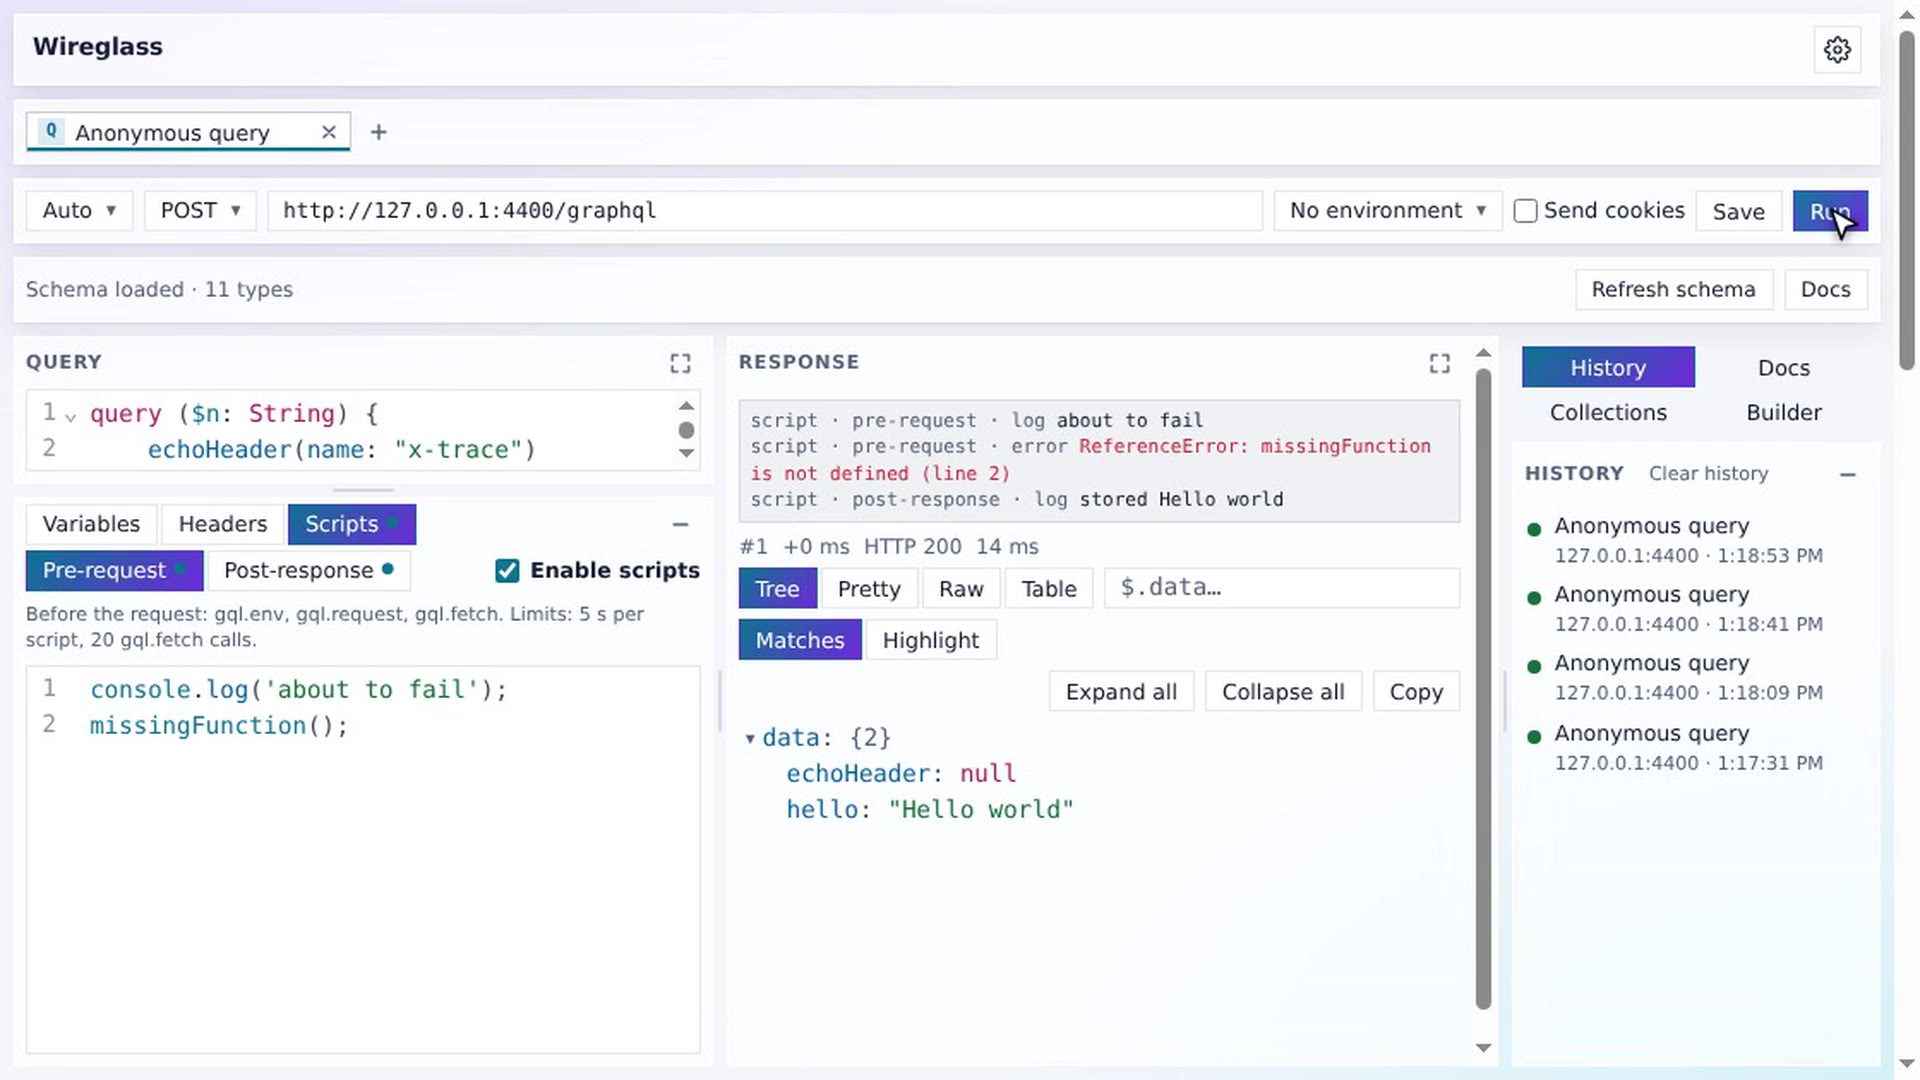 3:12ScriptsPre-request and post-response JavaScript, in a sandbox.
The DevTools panel
Open DevTools on a page and choose the Wireglass tab, to watch what the page does.
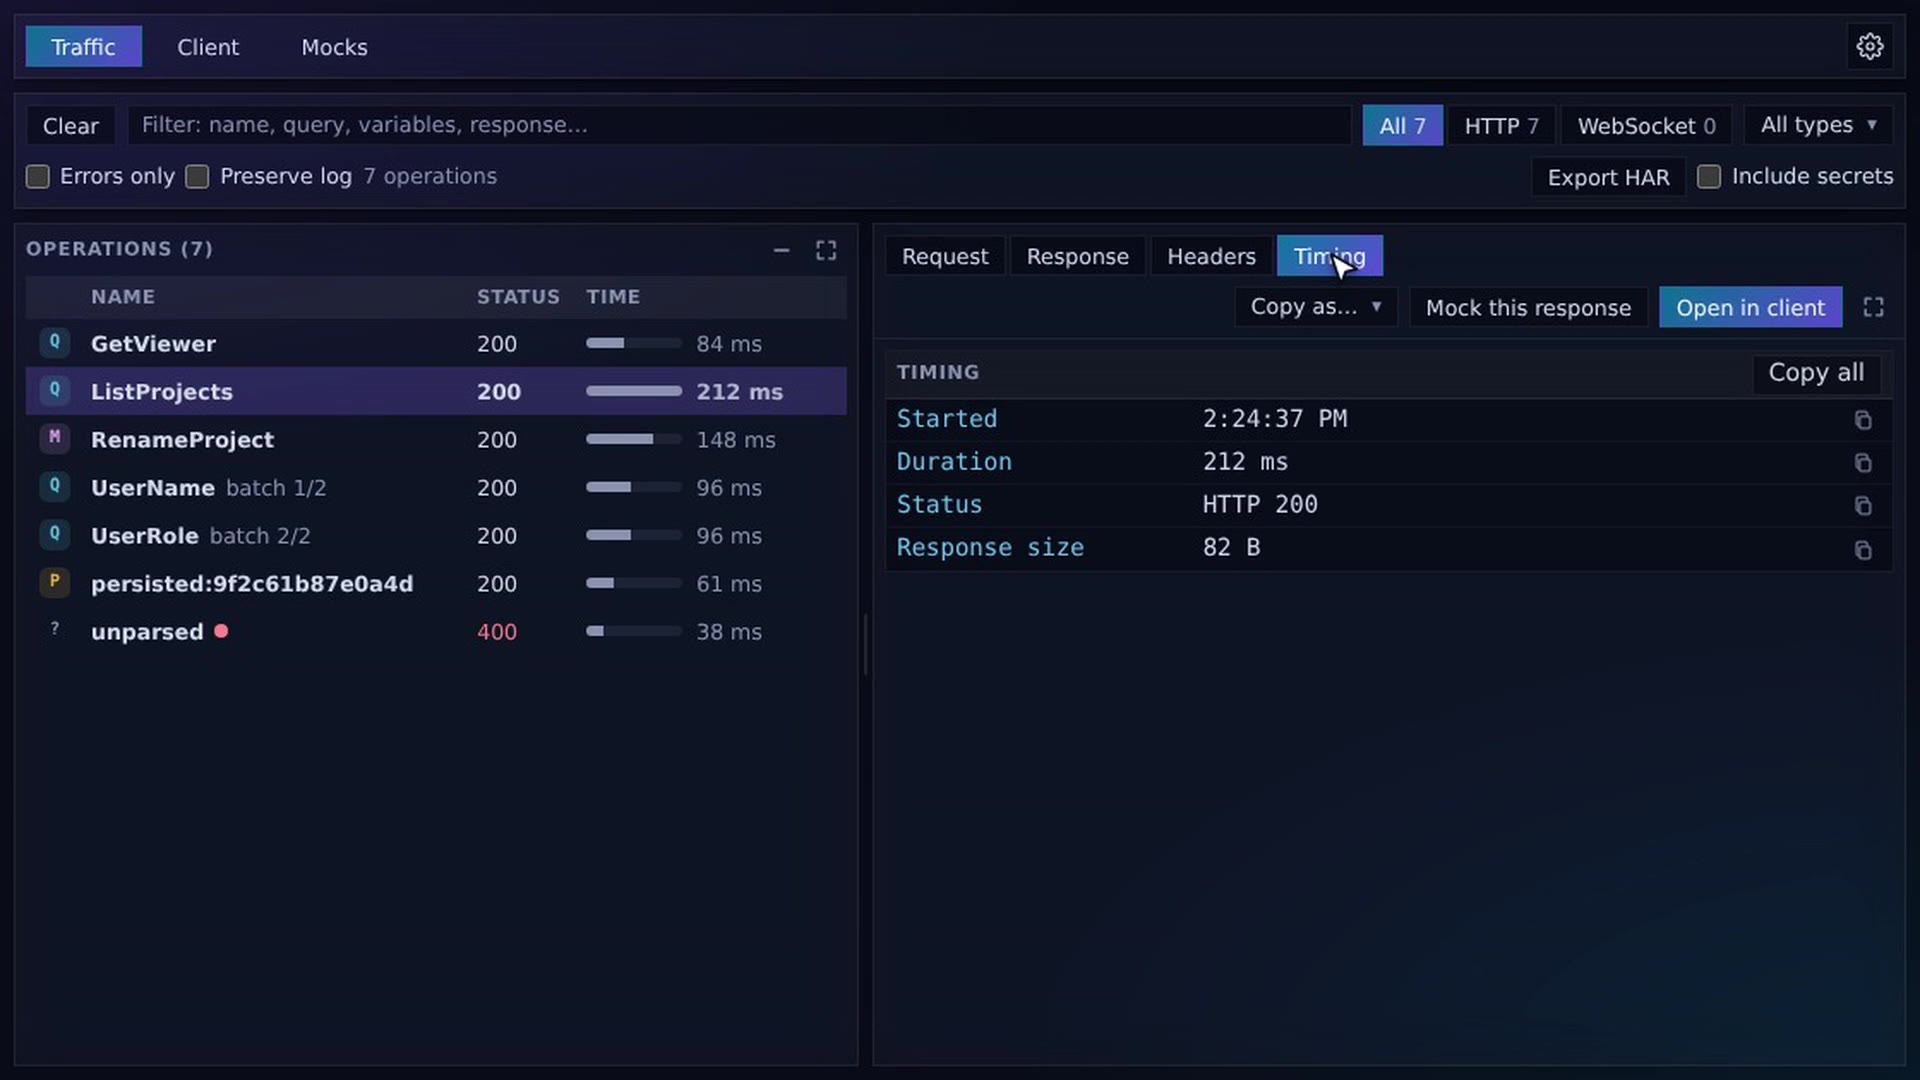
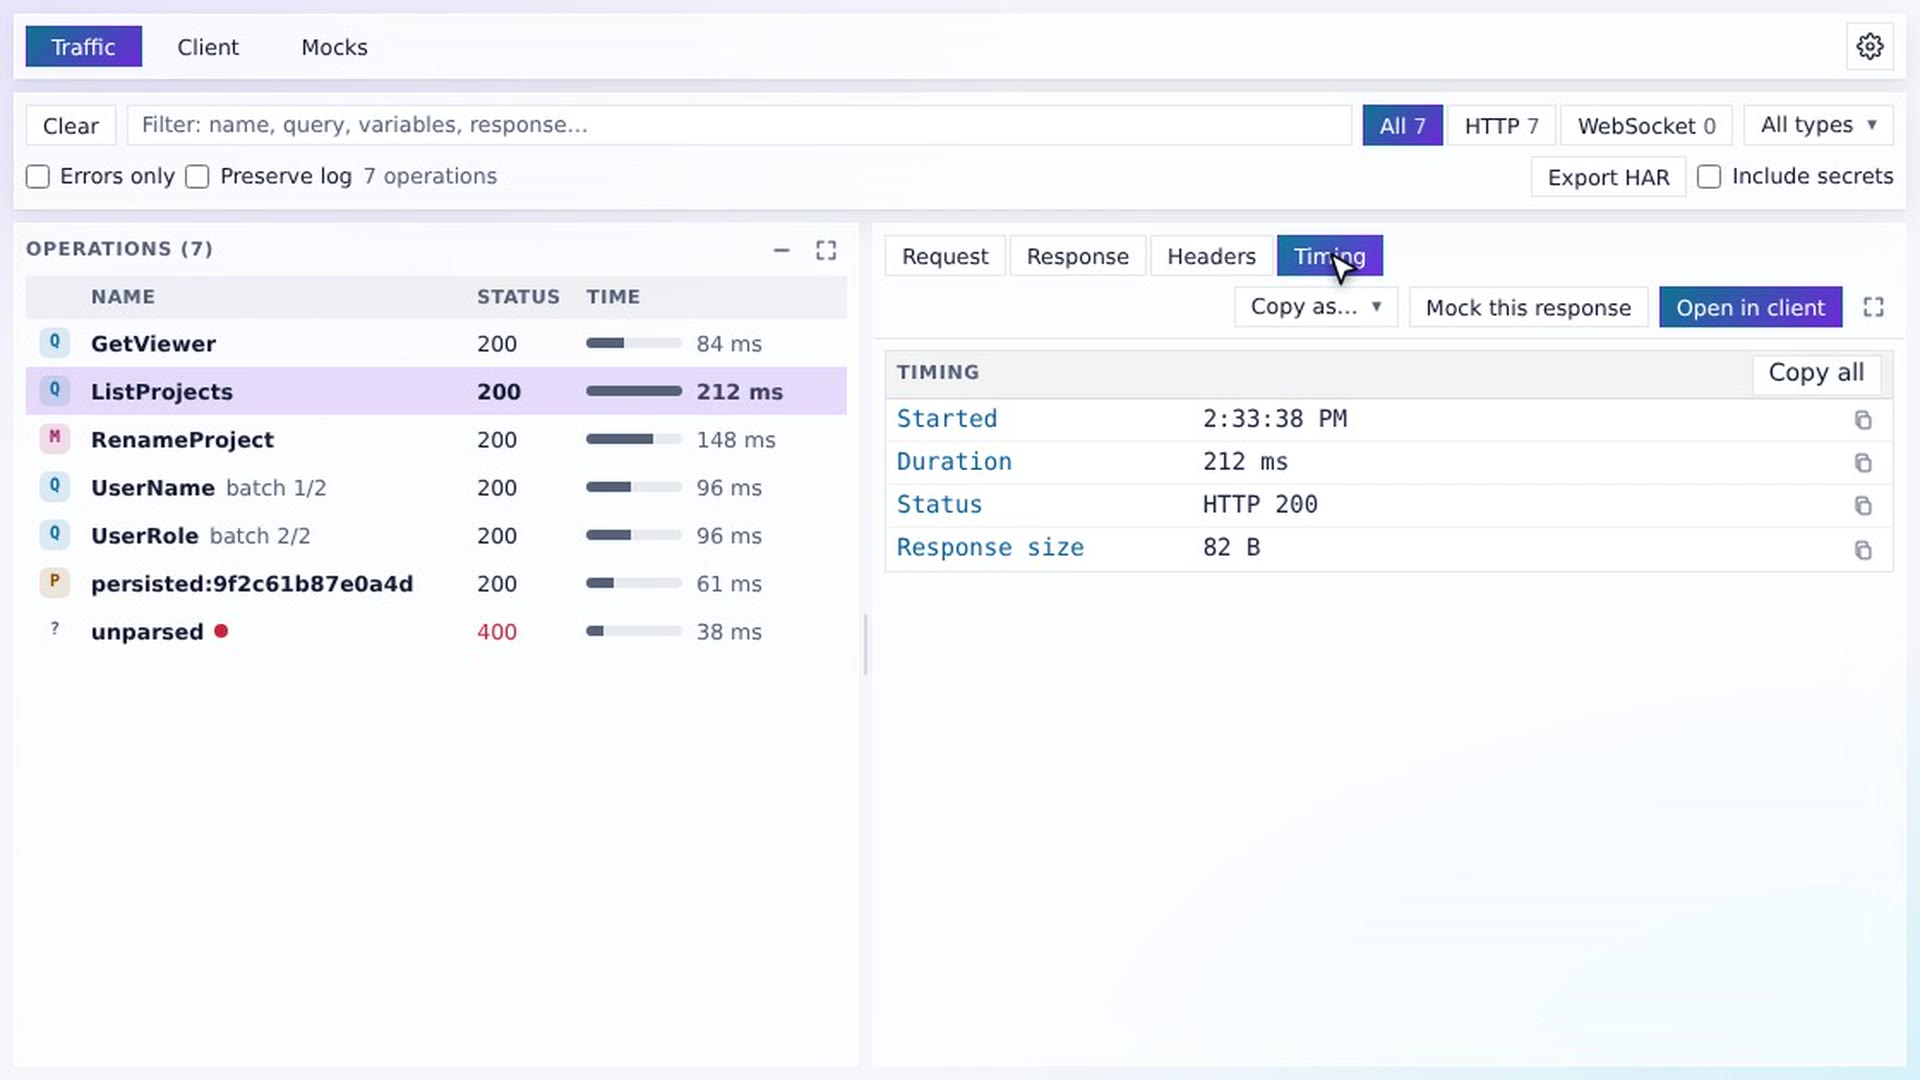 2:48Capturing trafficEvery GraphQL operation the page makes, over HTTP and WebSocket.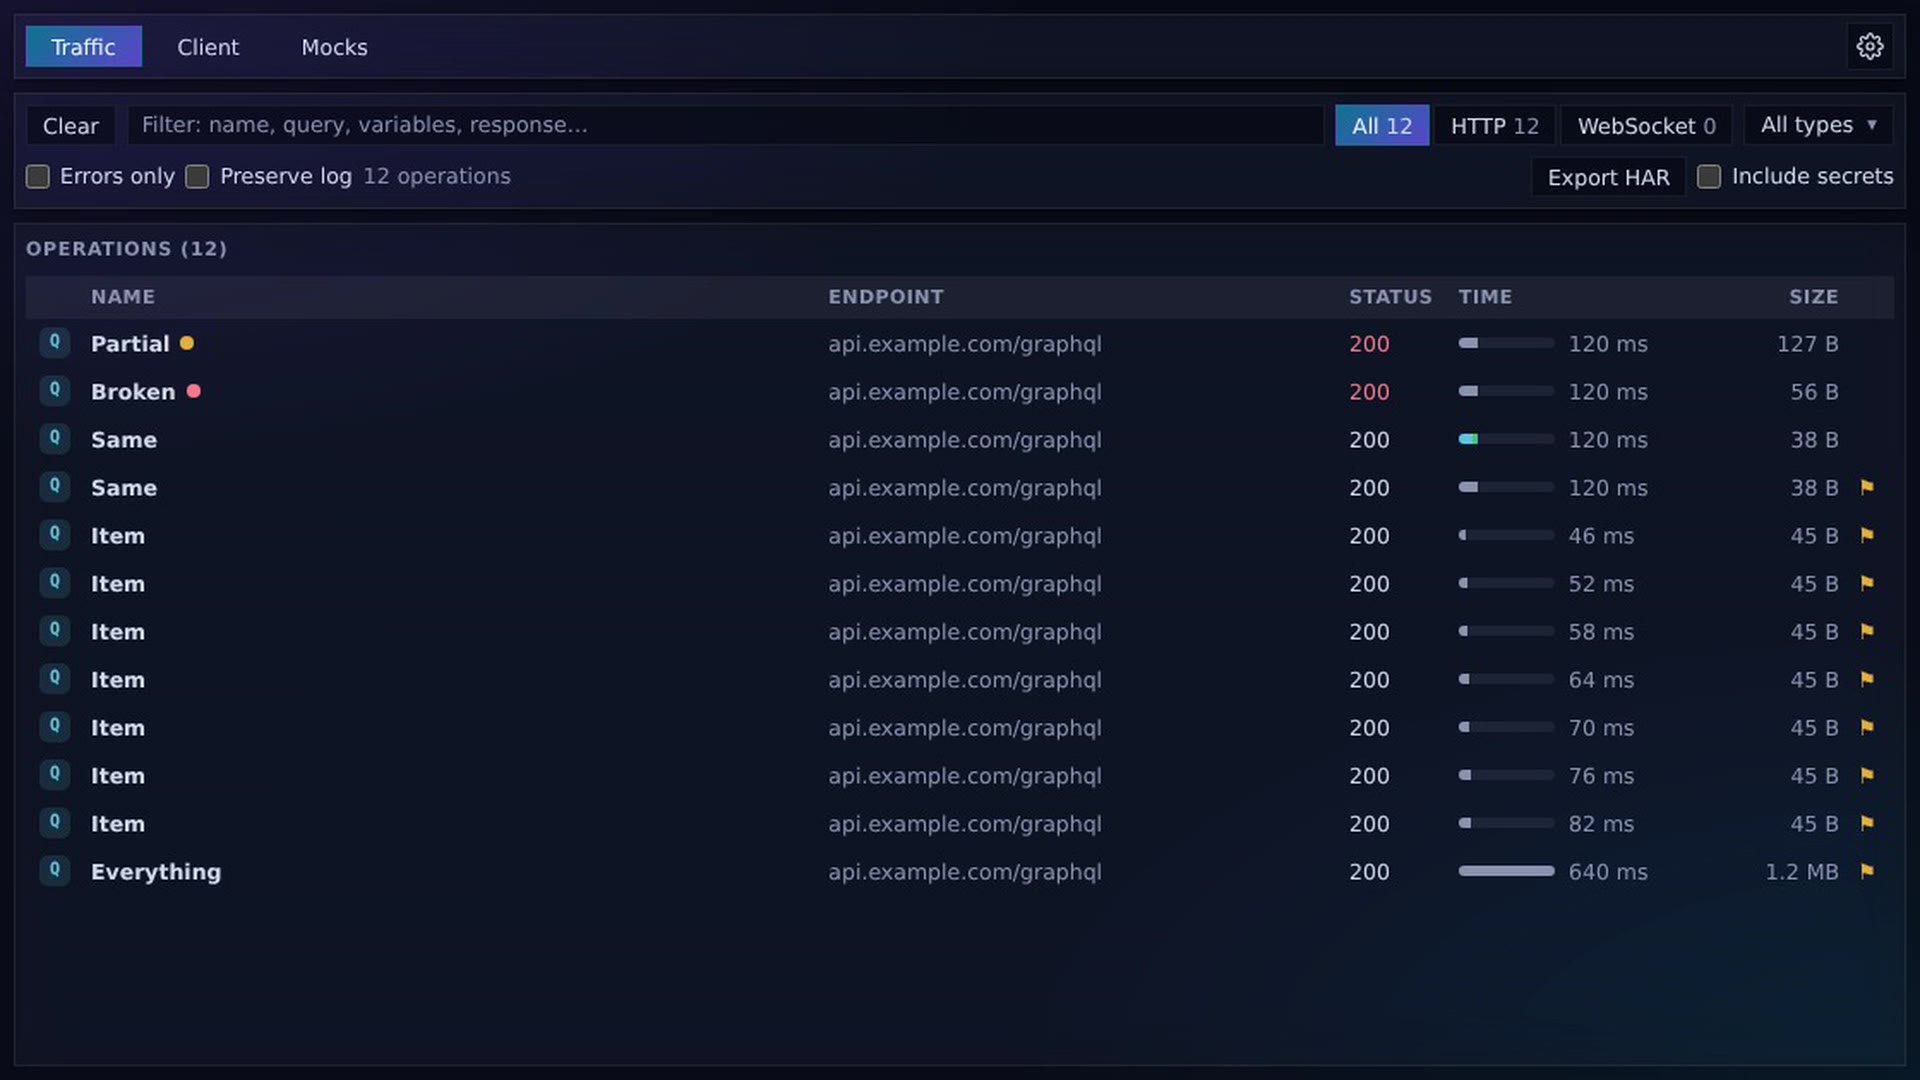
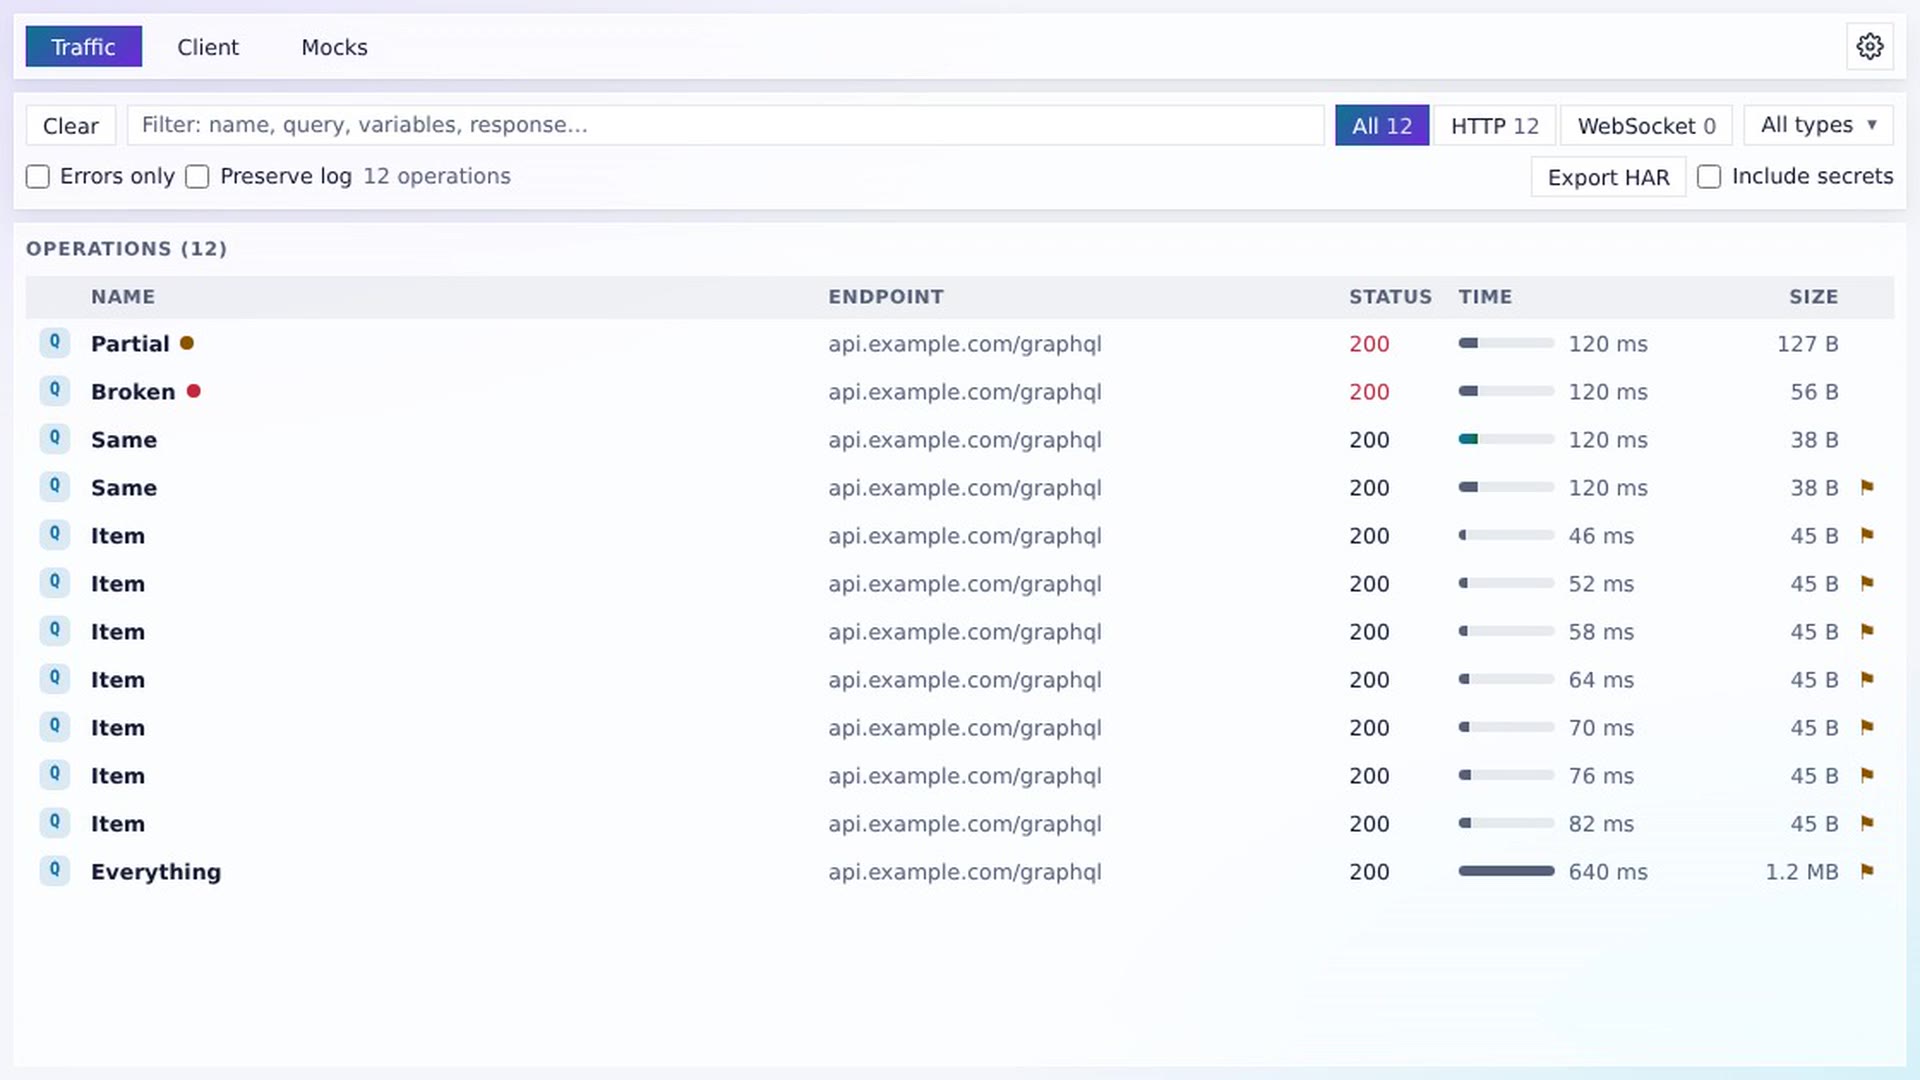 3:36Errors and insightsFlags for errors, duplicate calls, N+1 patterns and heavy responses.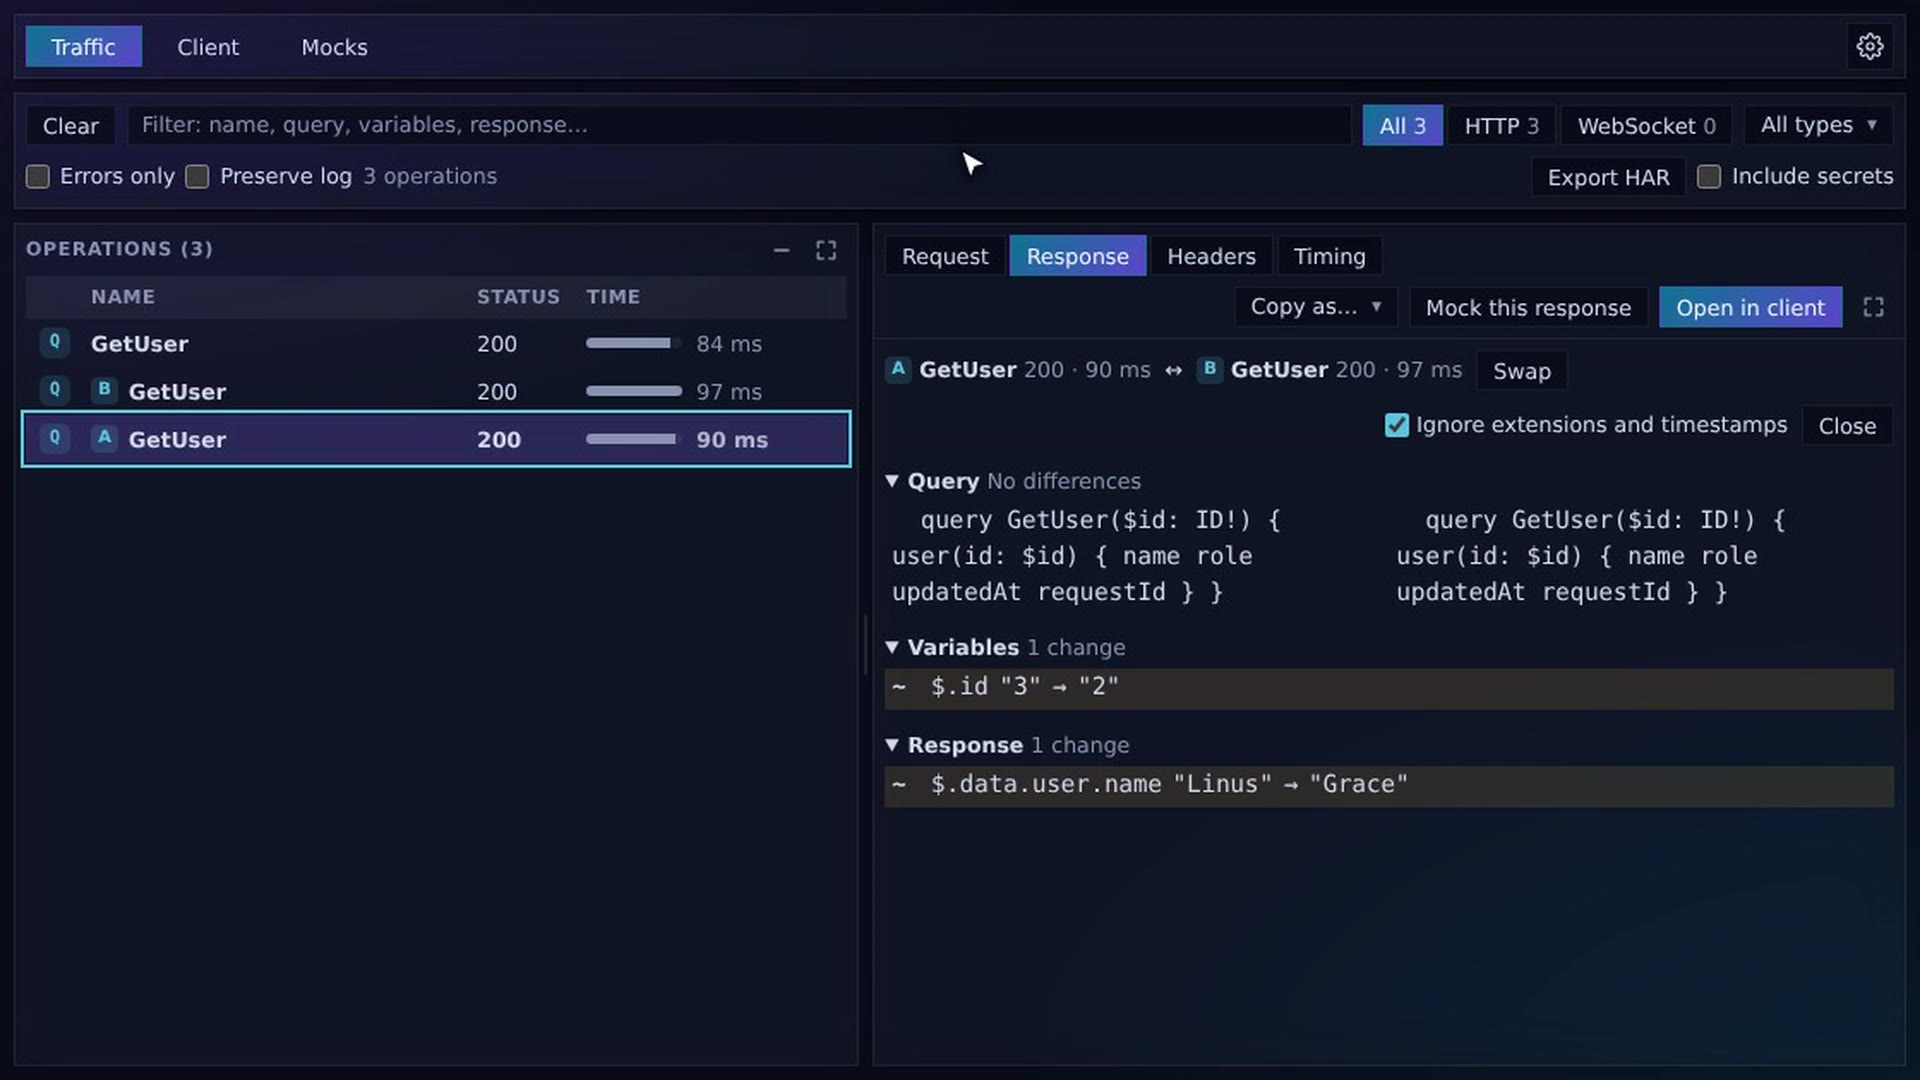
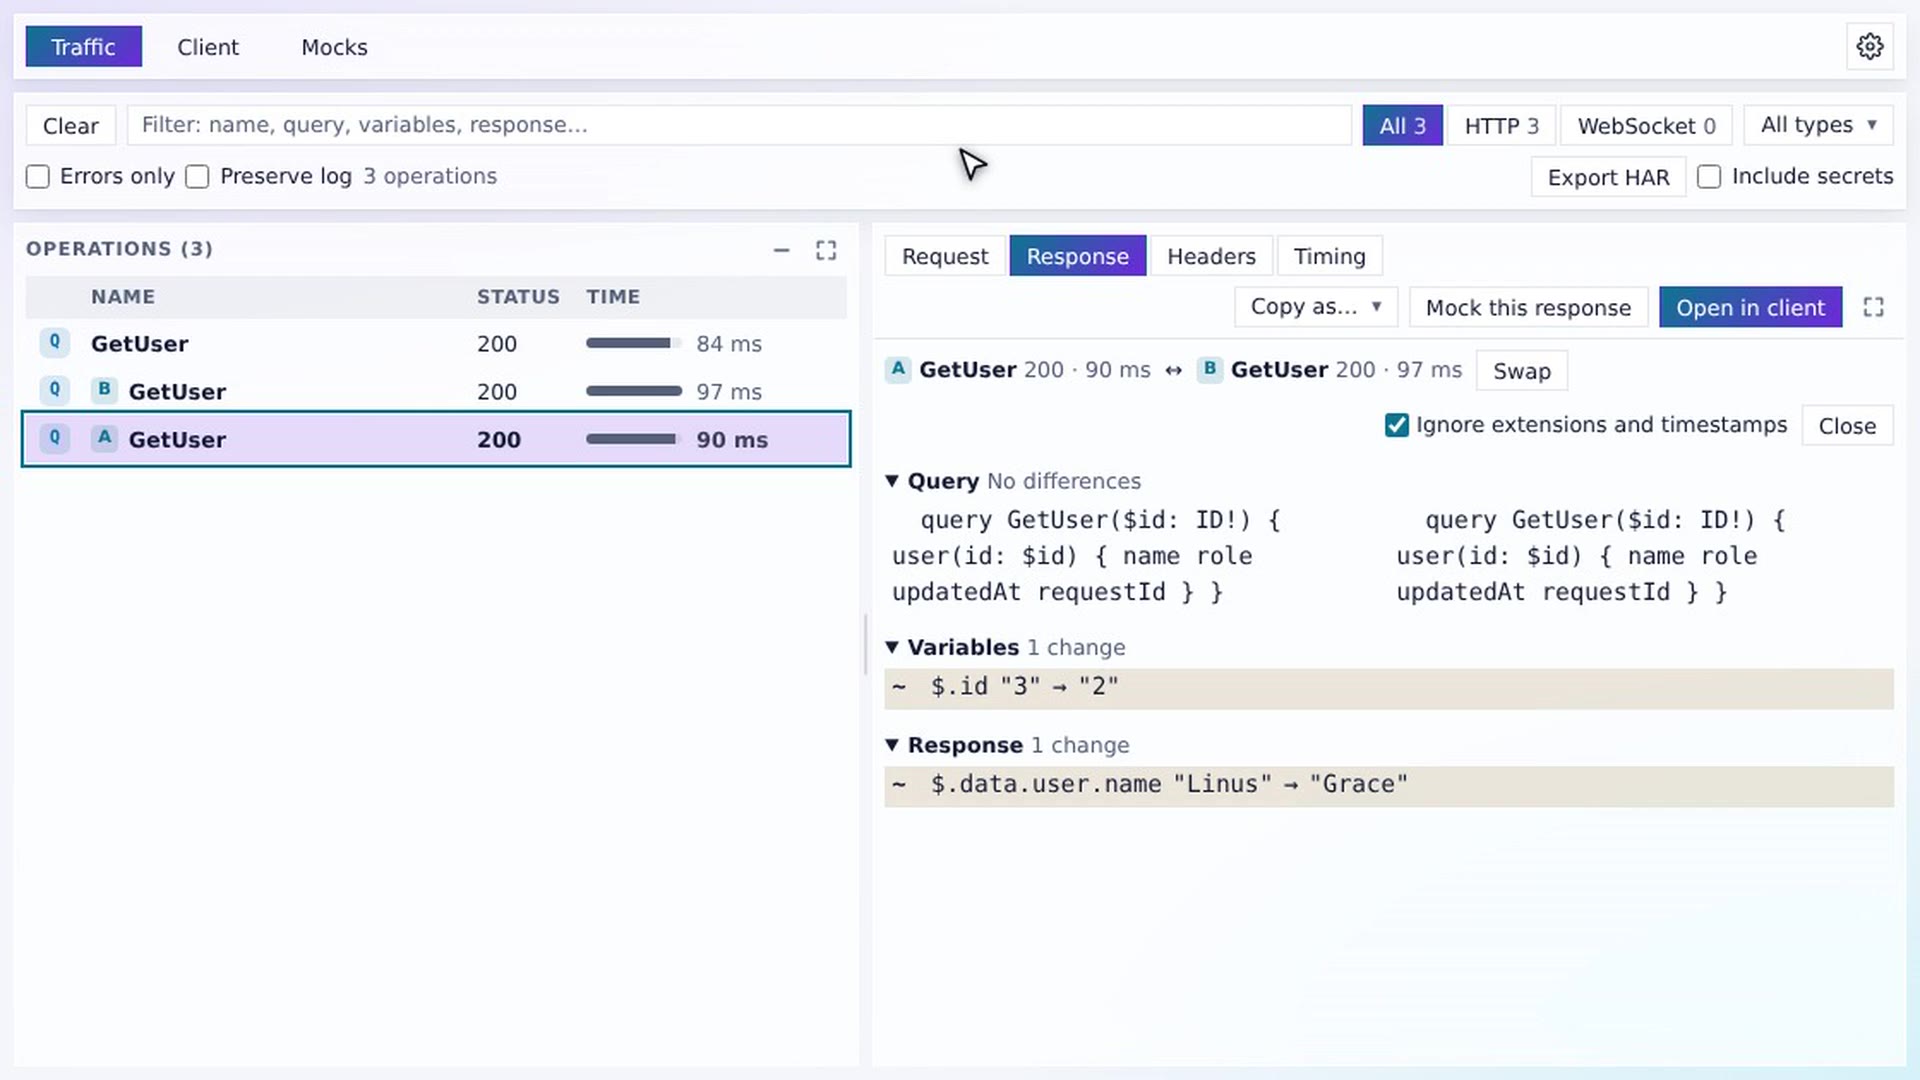 2:35CompareDiff the query, variables and response of two requests.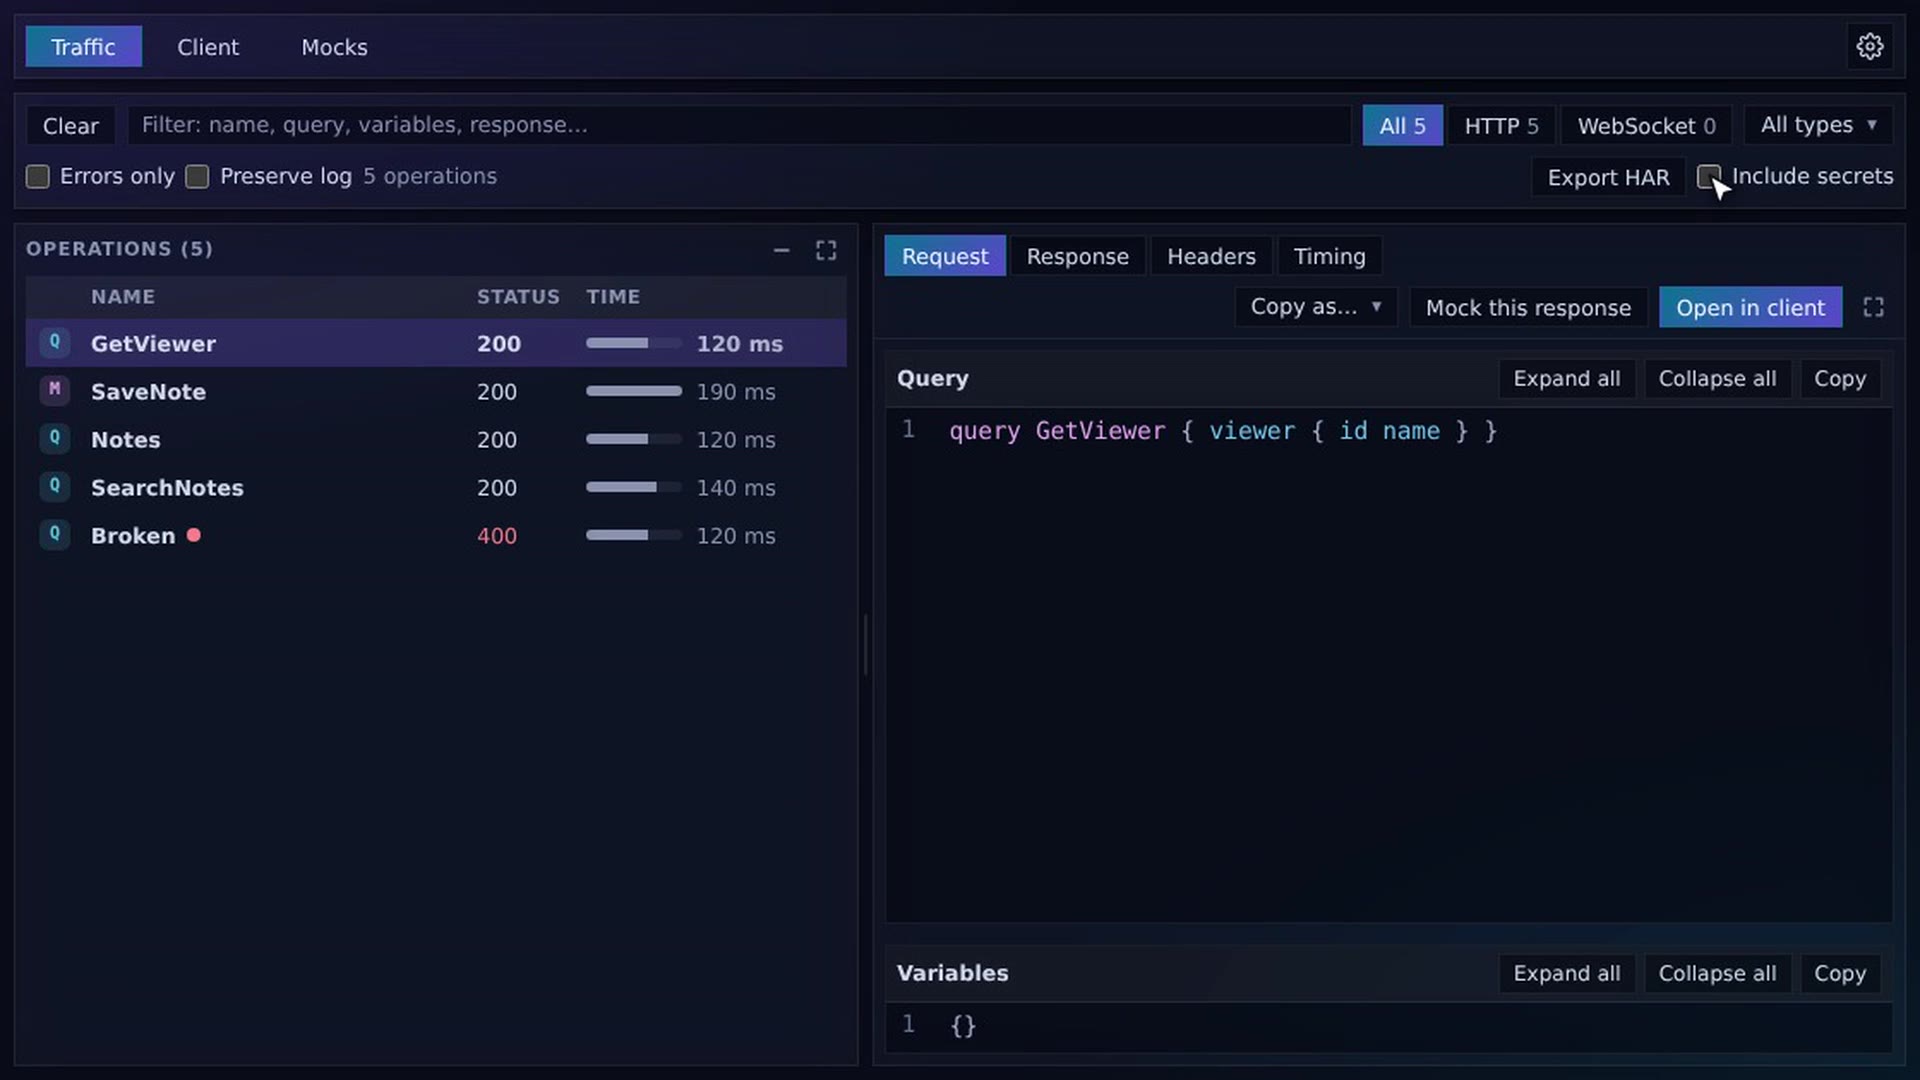
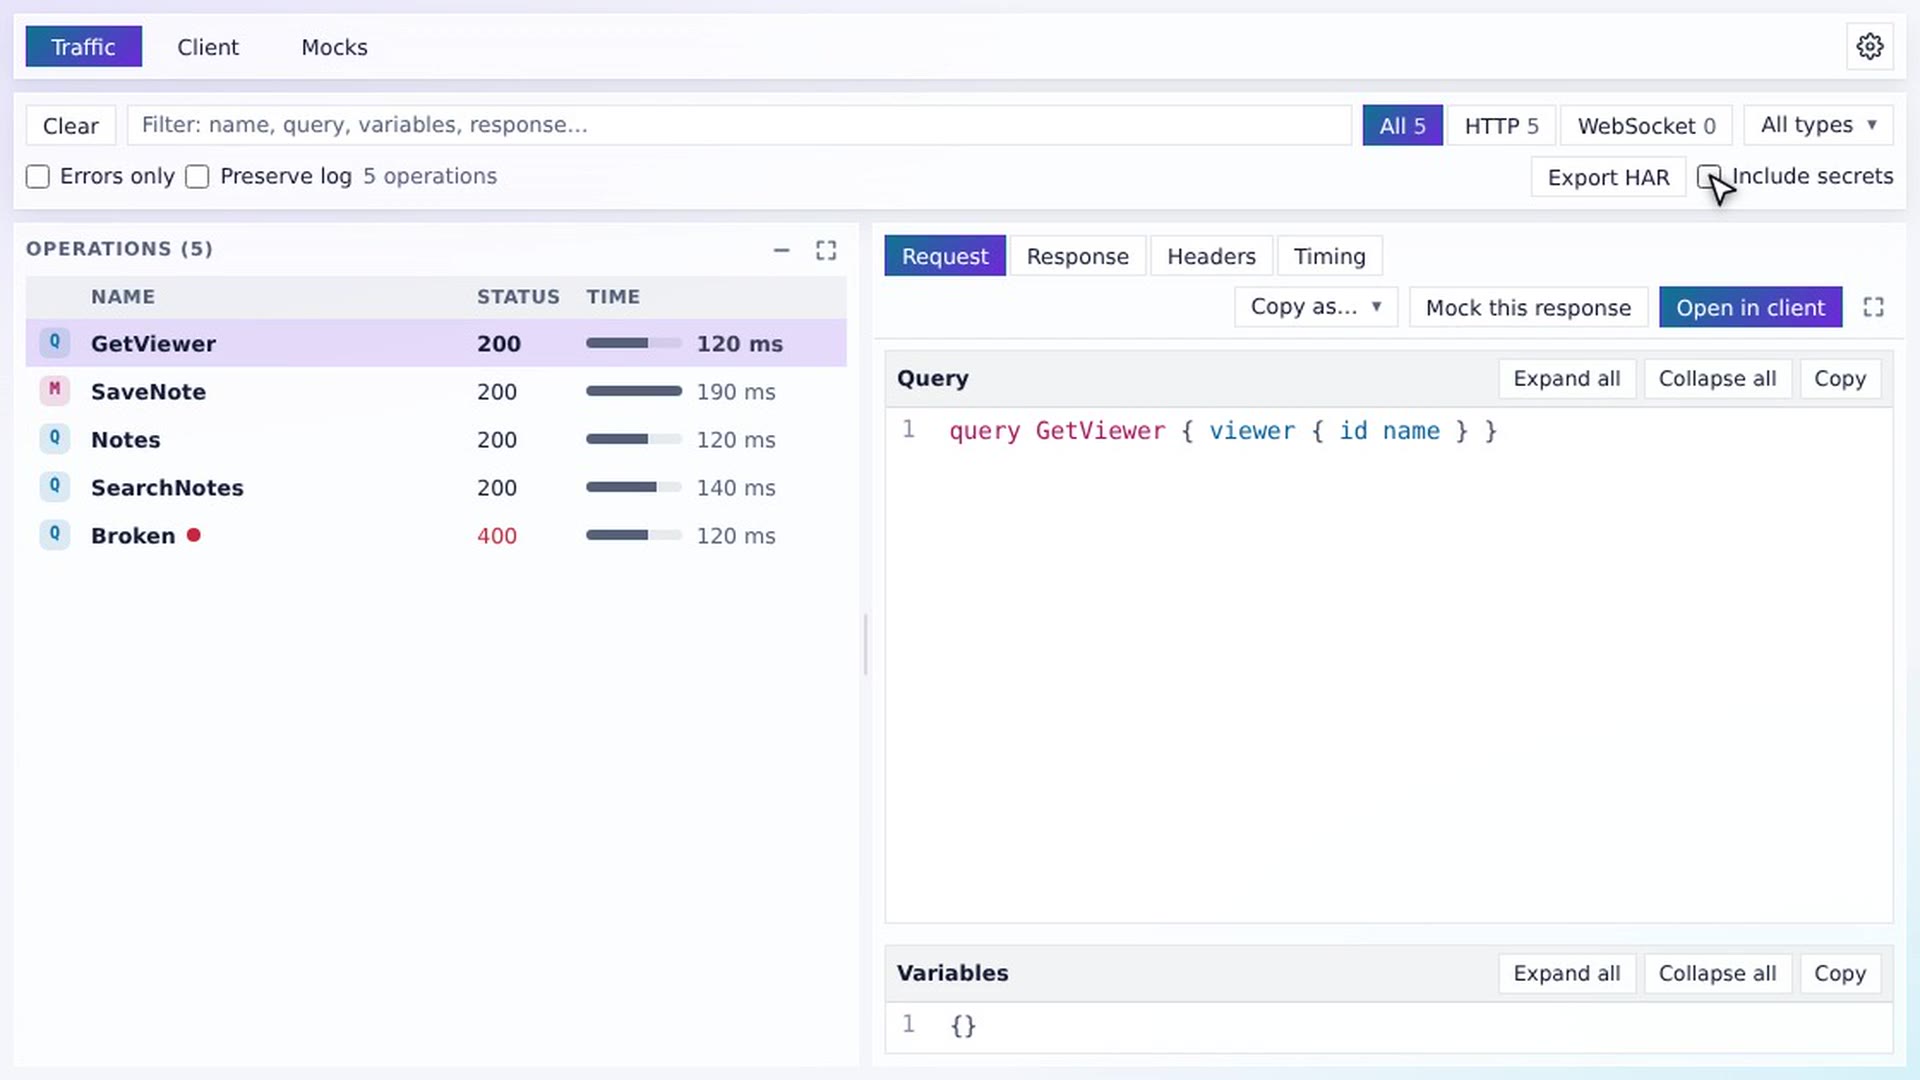 3:03Filter and exportSearch everything, copy as cURL or fetch, export HAR without leaking tokens.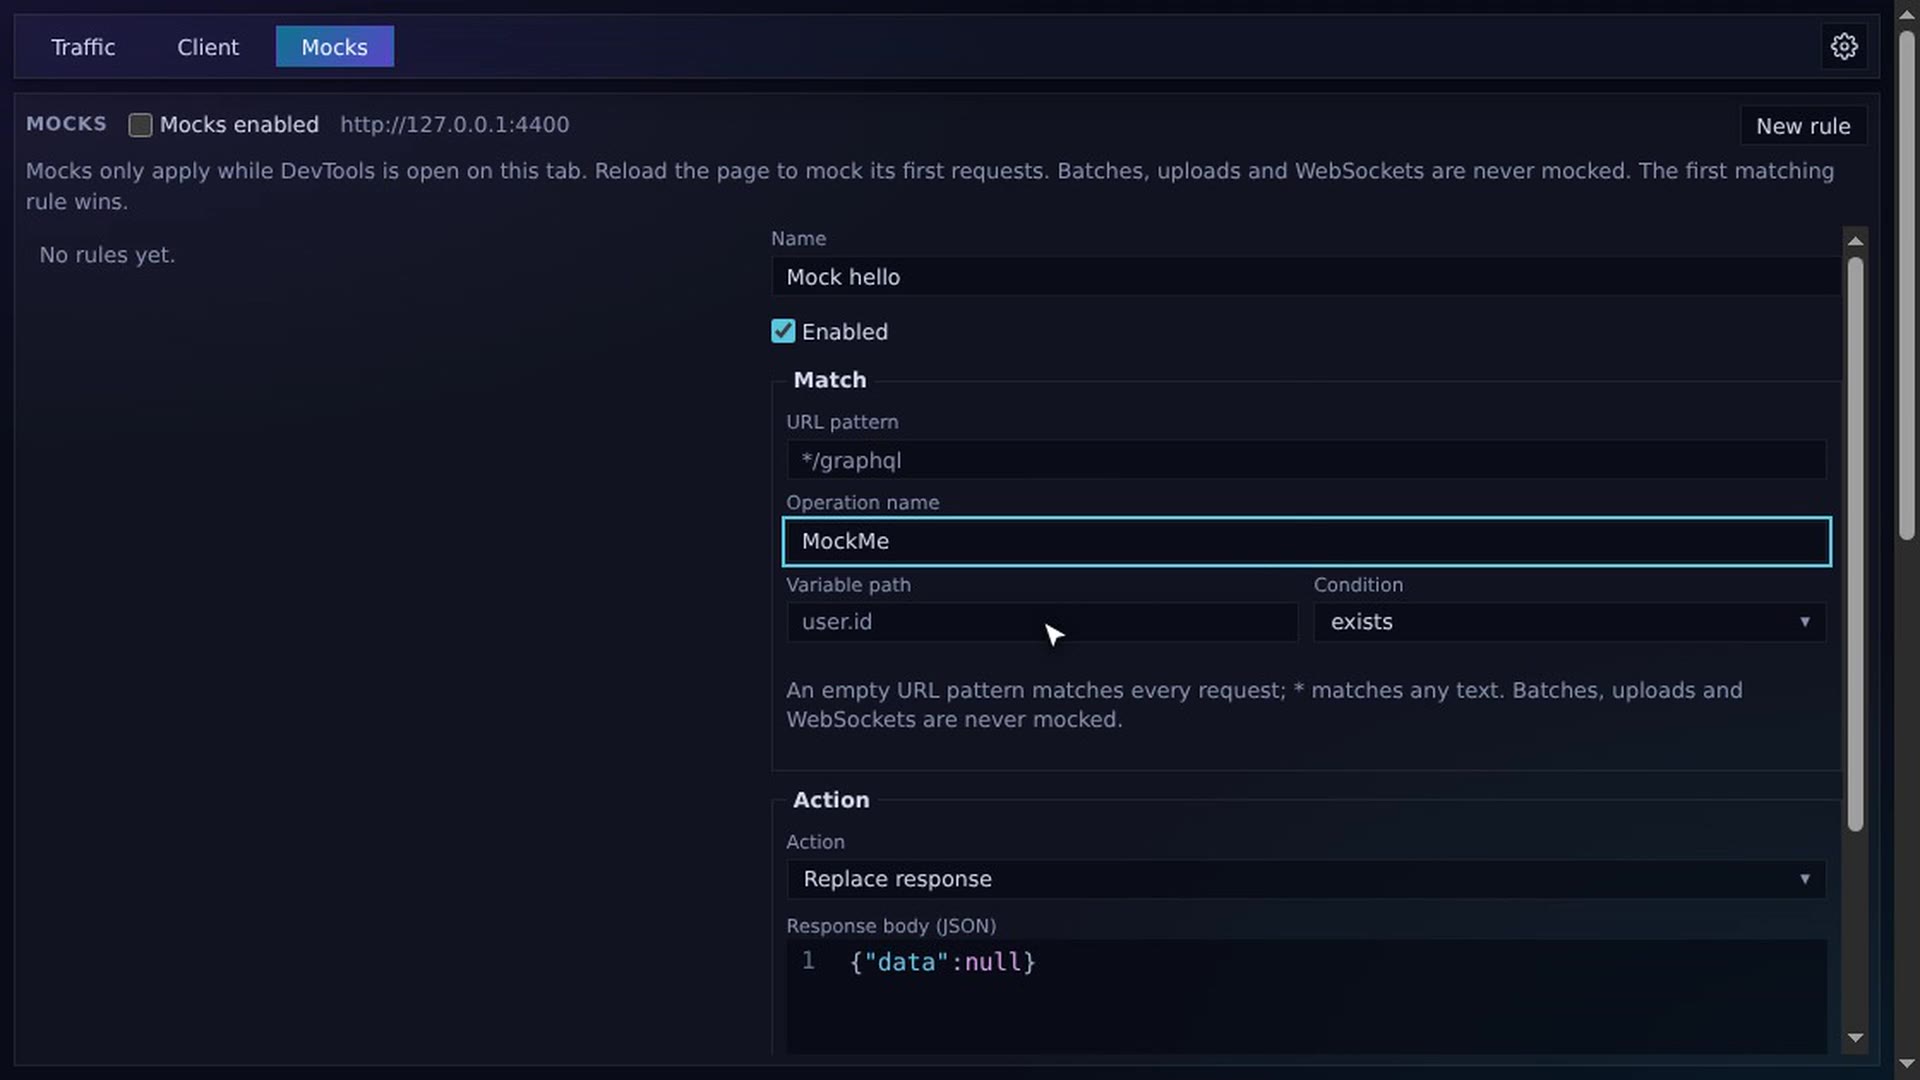
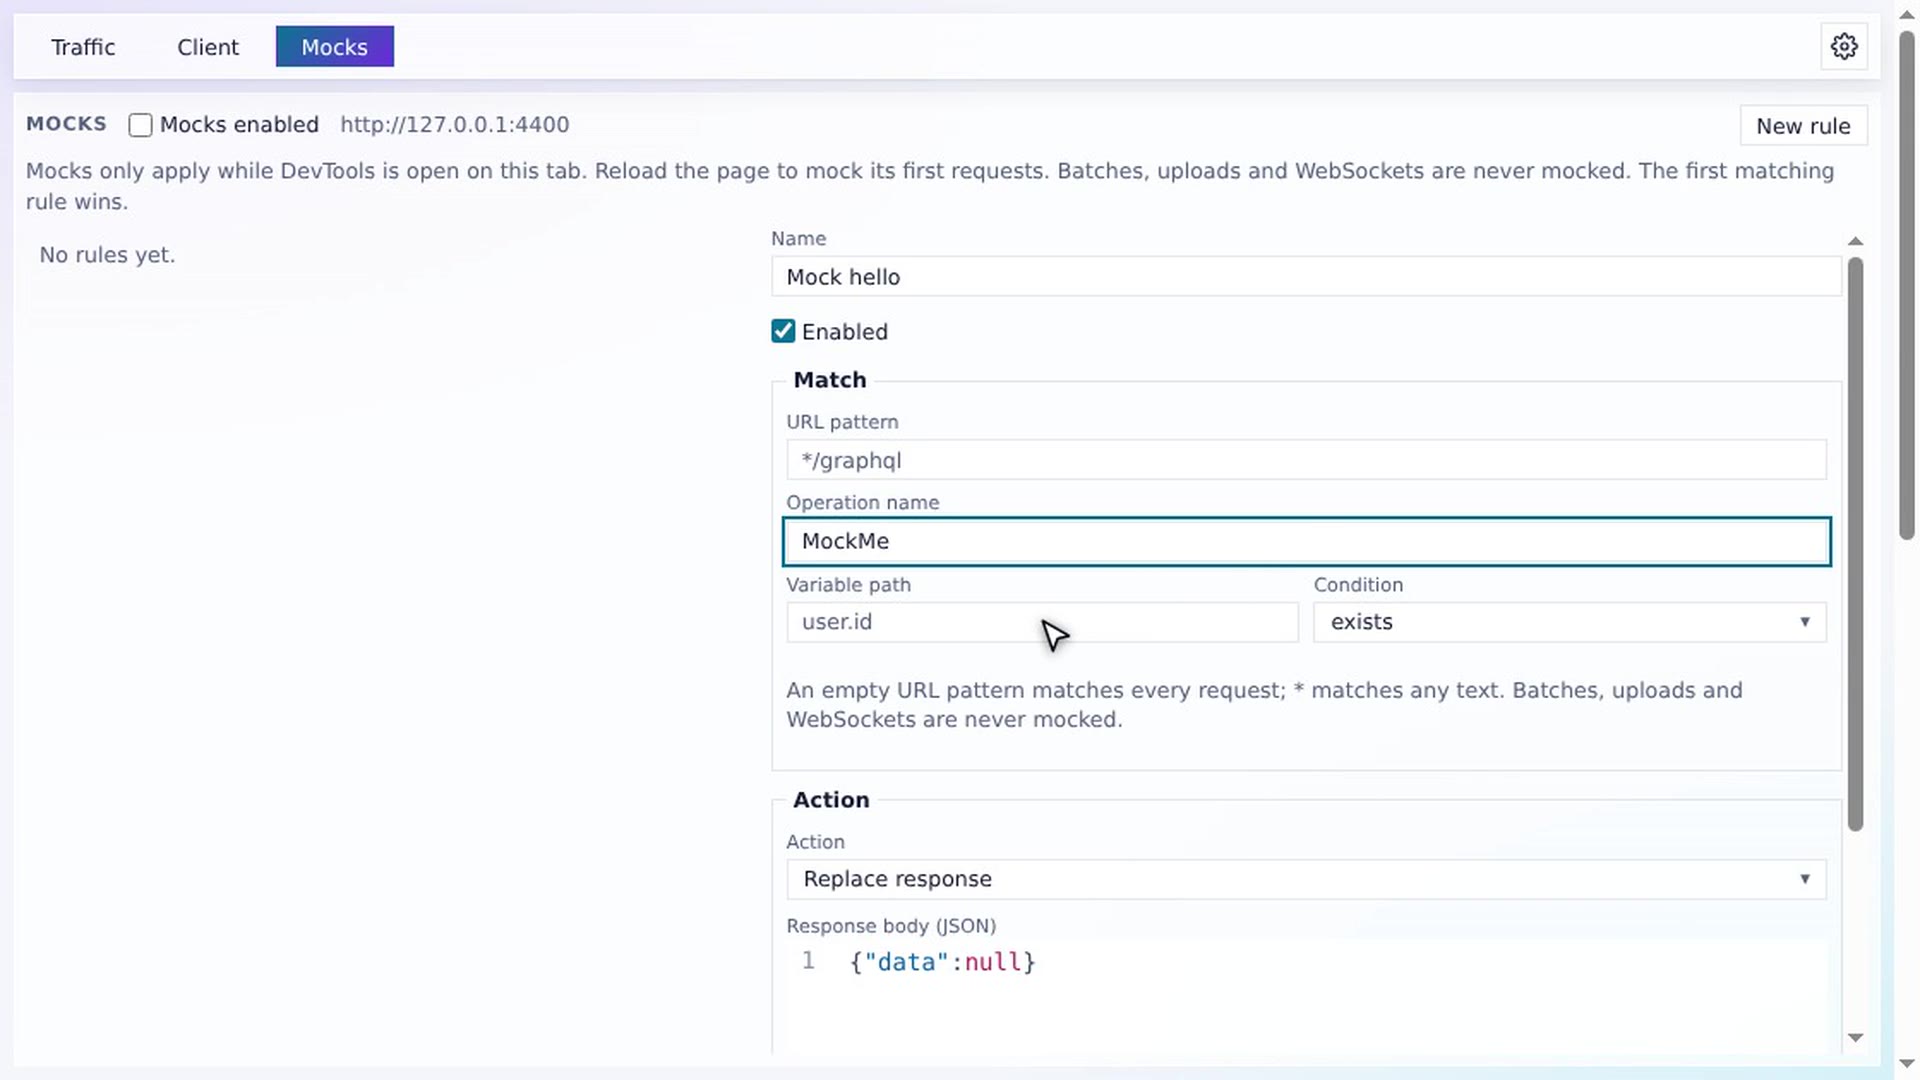 3:30MocksChange what the page receives, without touching the server.
Everywhere
Shape Wireglass to your taste, and reach any command from the keyboard.
© 2026 Melliforge. All rights reserved.