
Timeline (swim lanes)
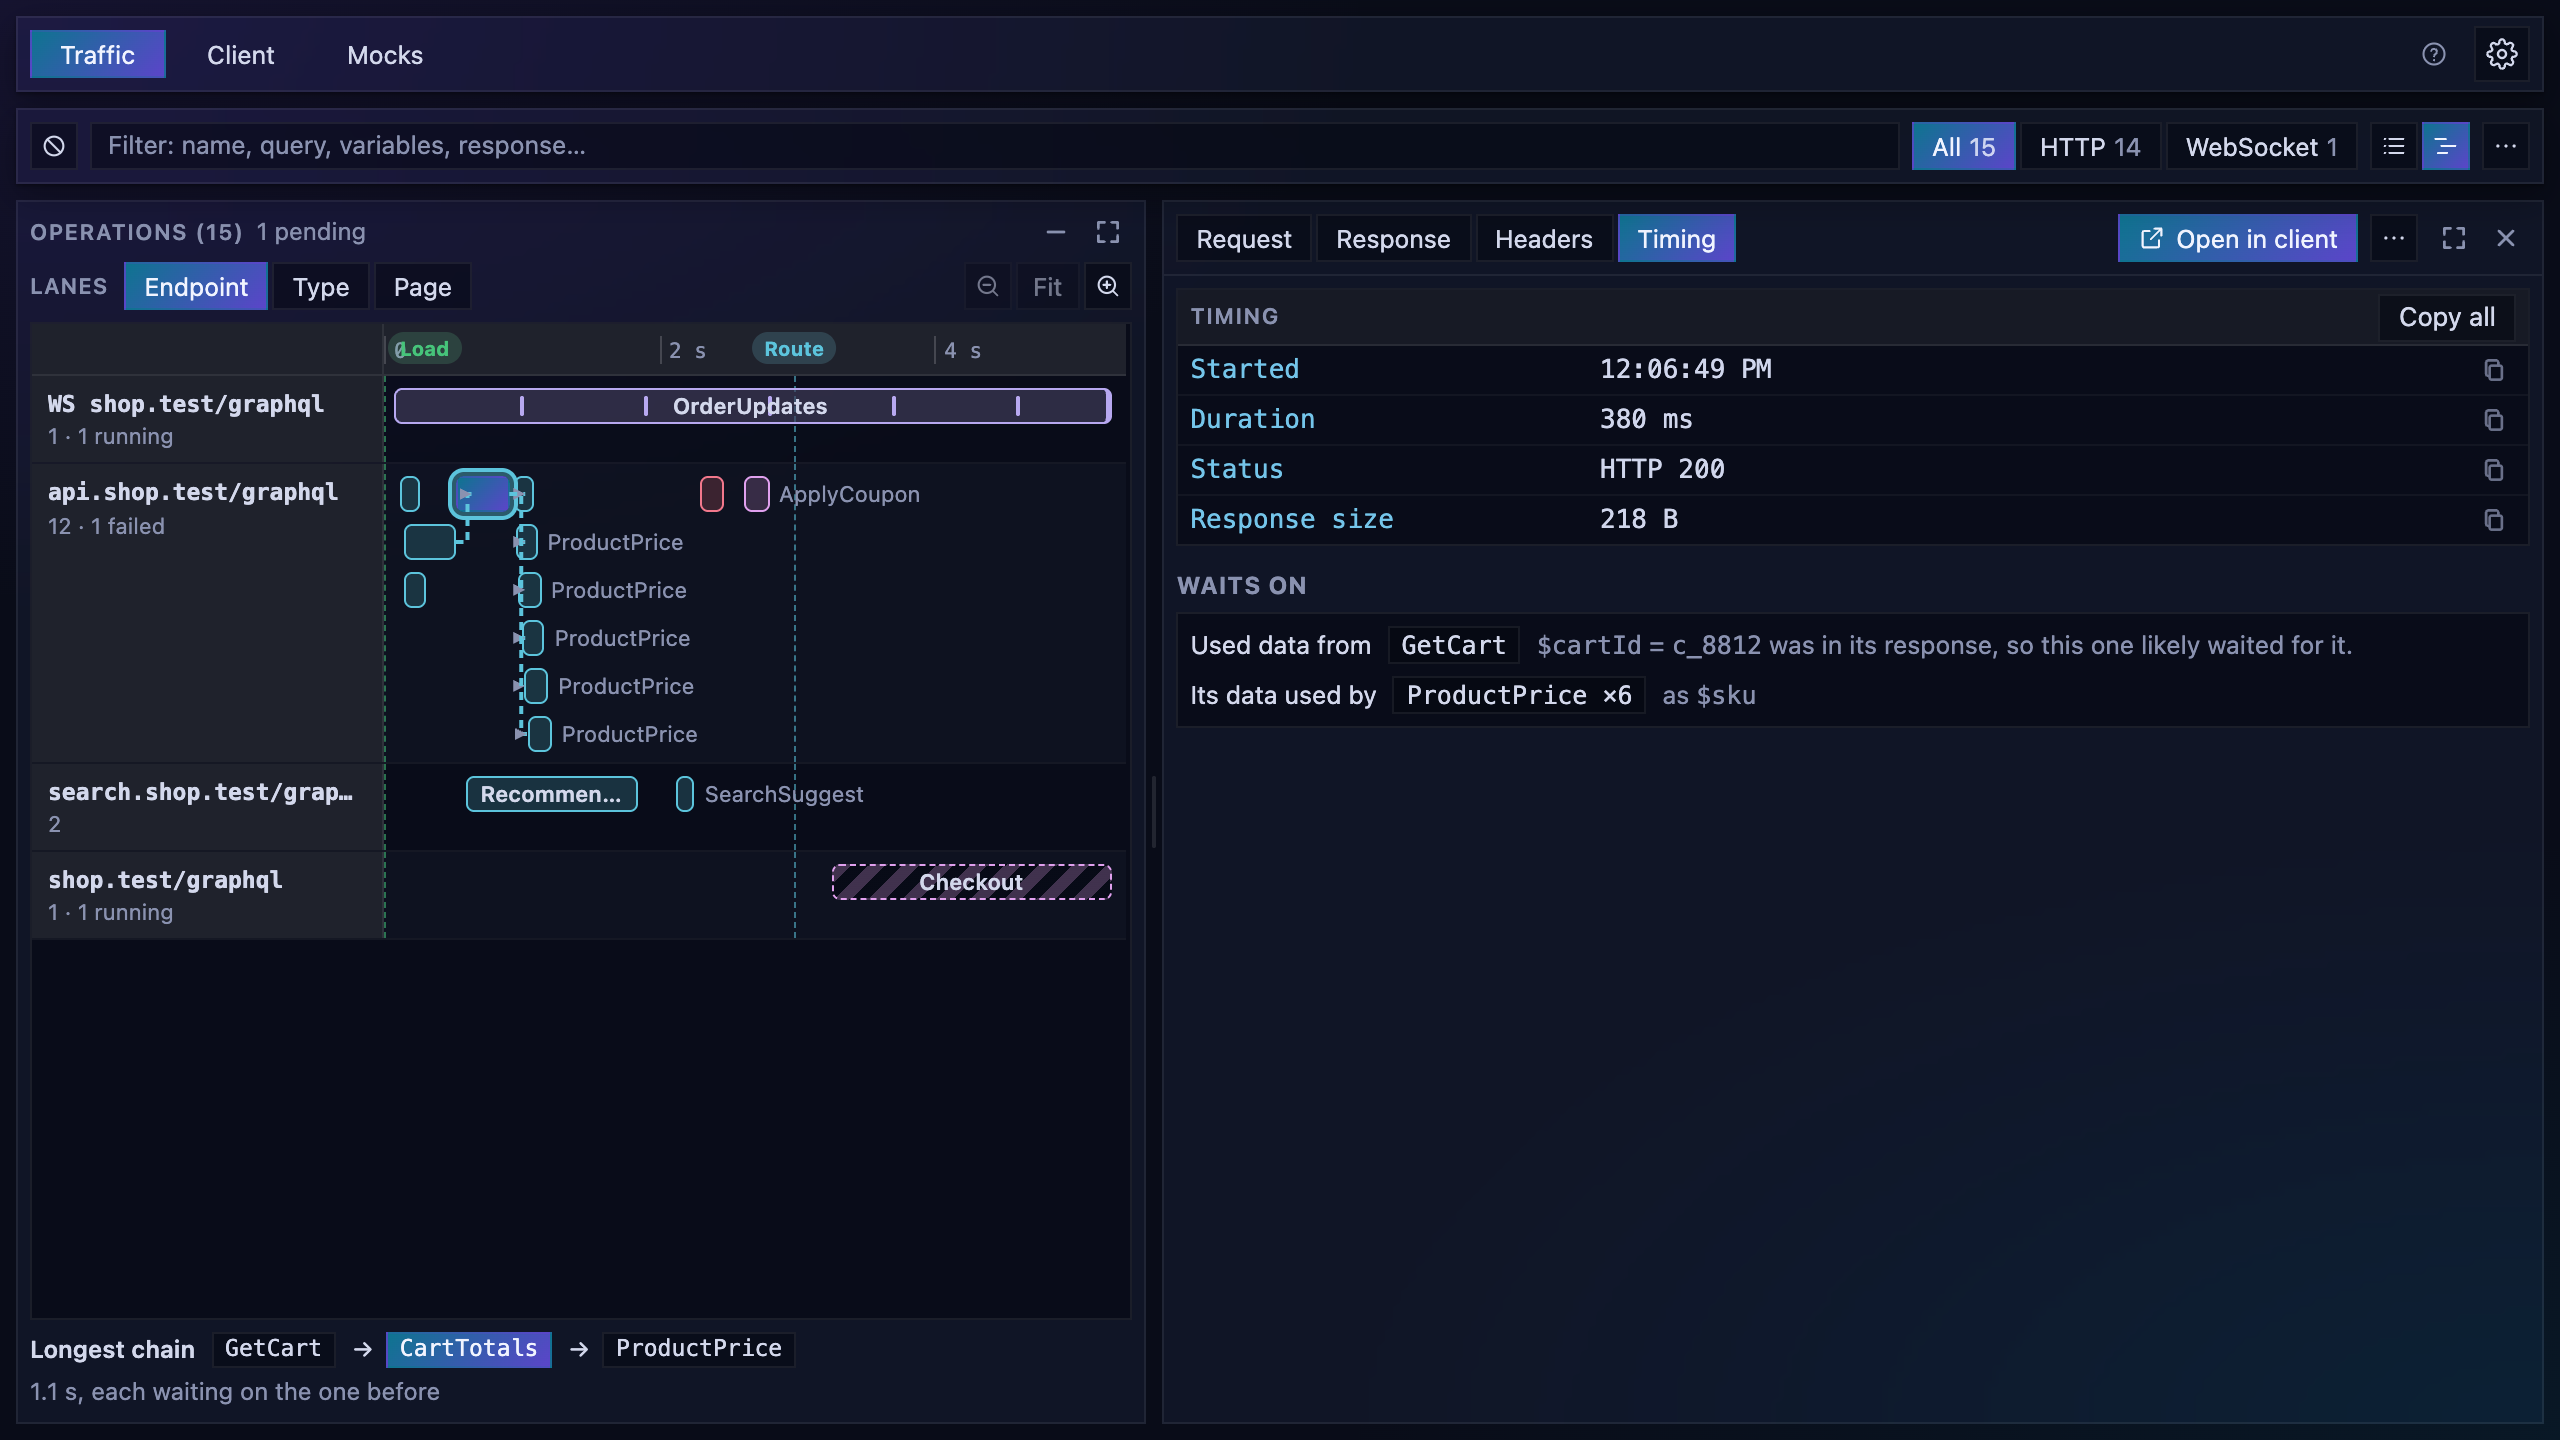
The list tells you what a page asked for. The timeline shows when: which operations ran side by side, which waited for another, and what kept the page busy.
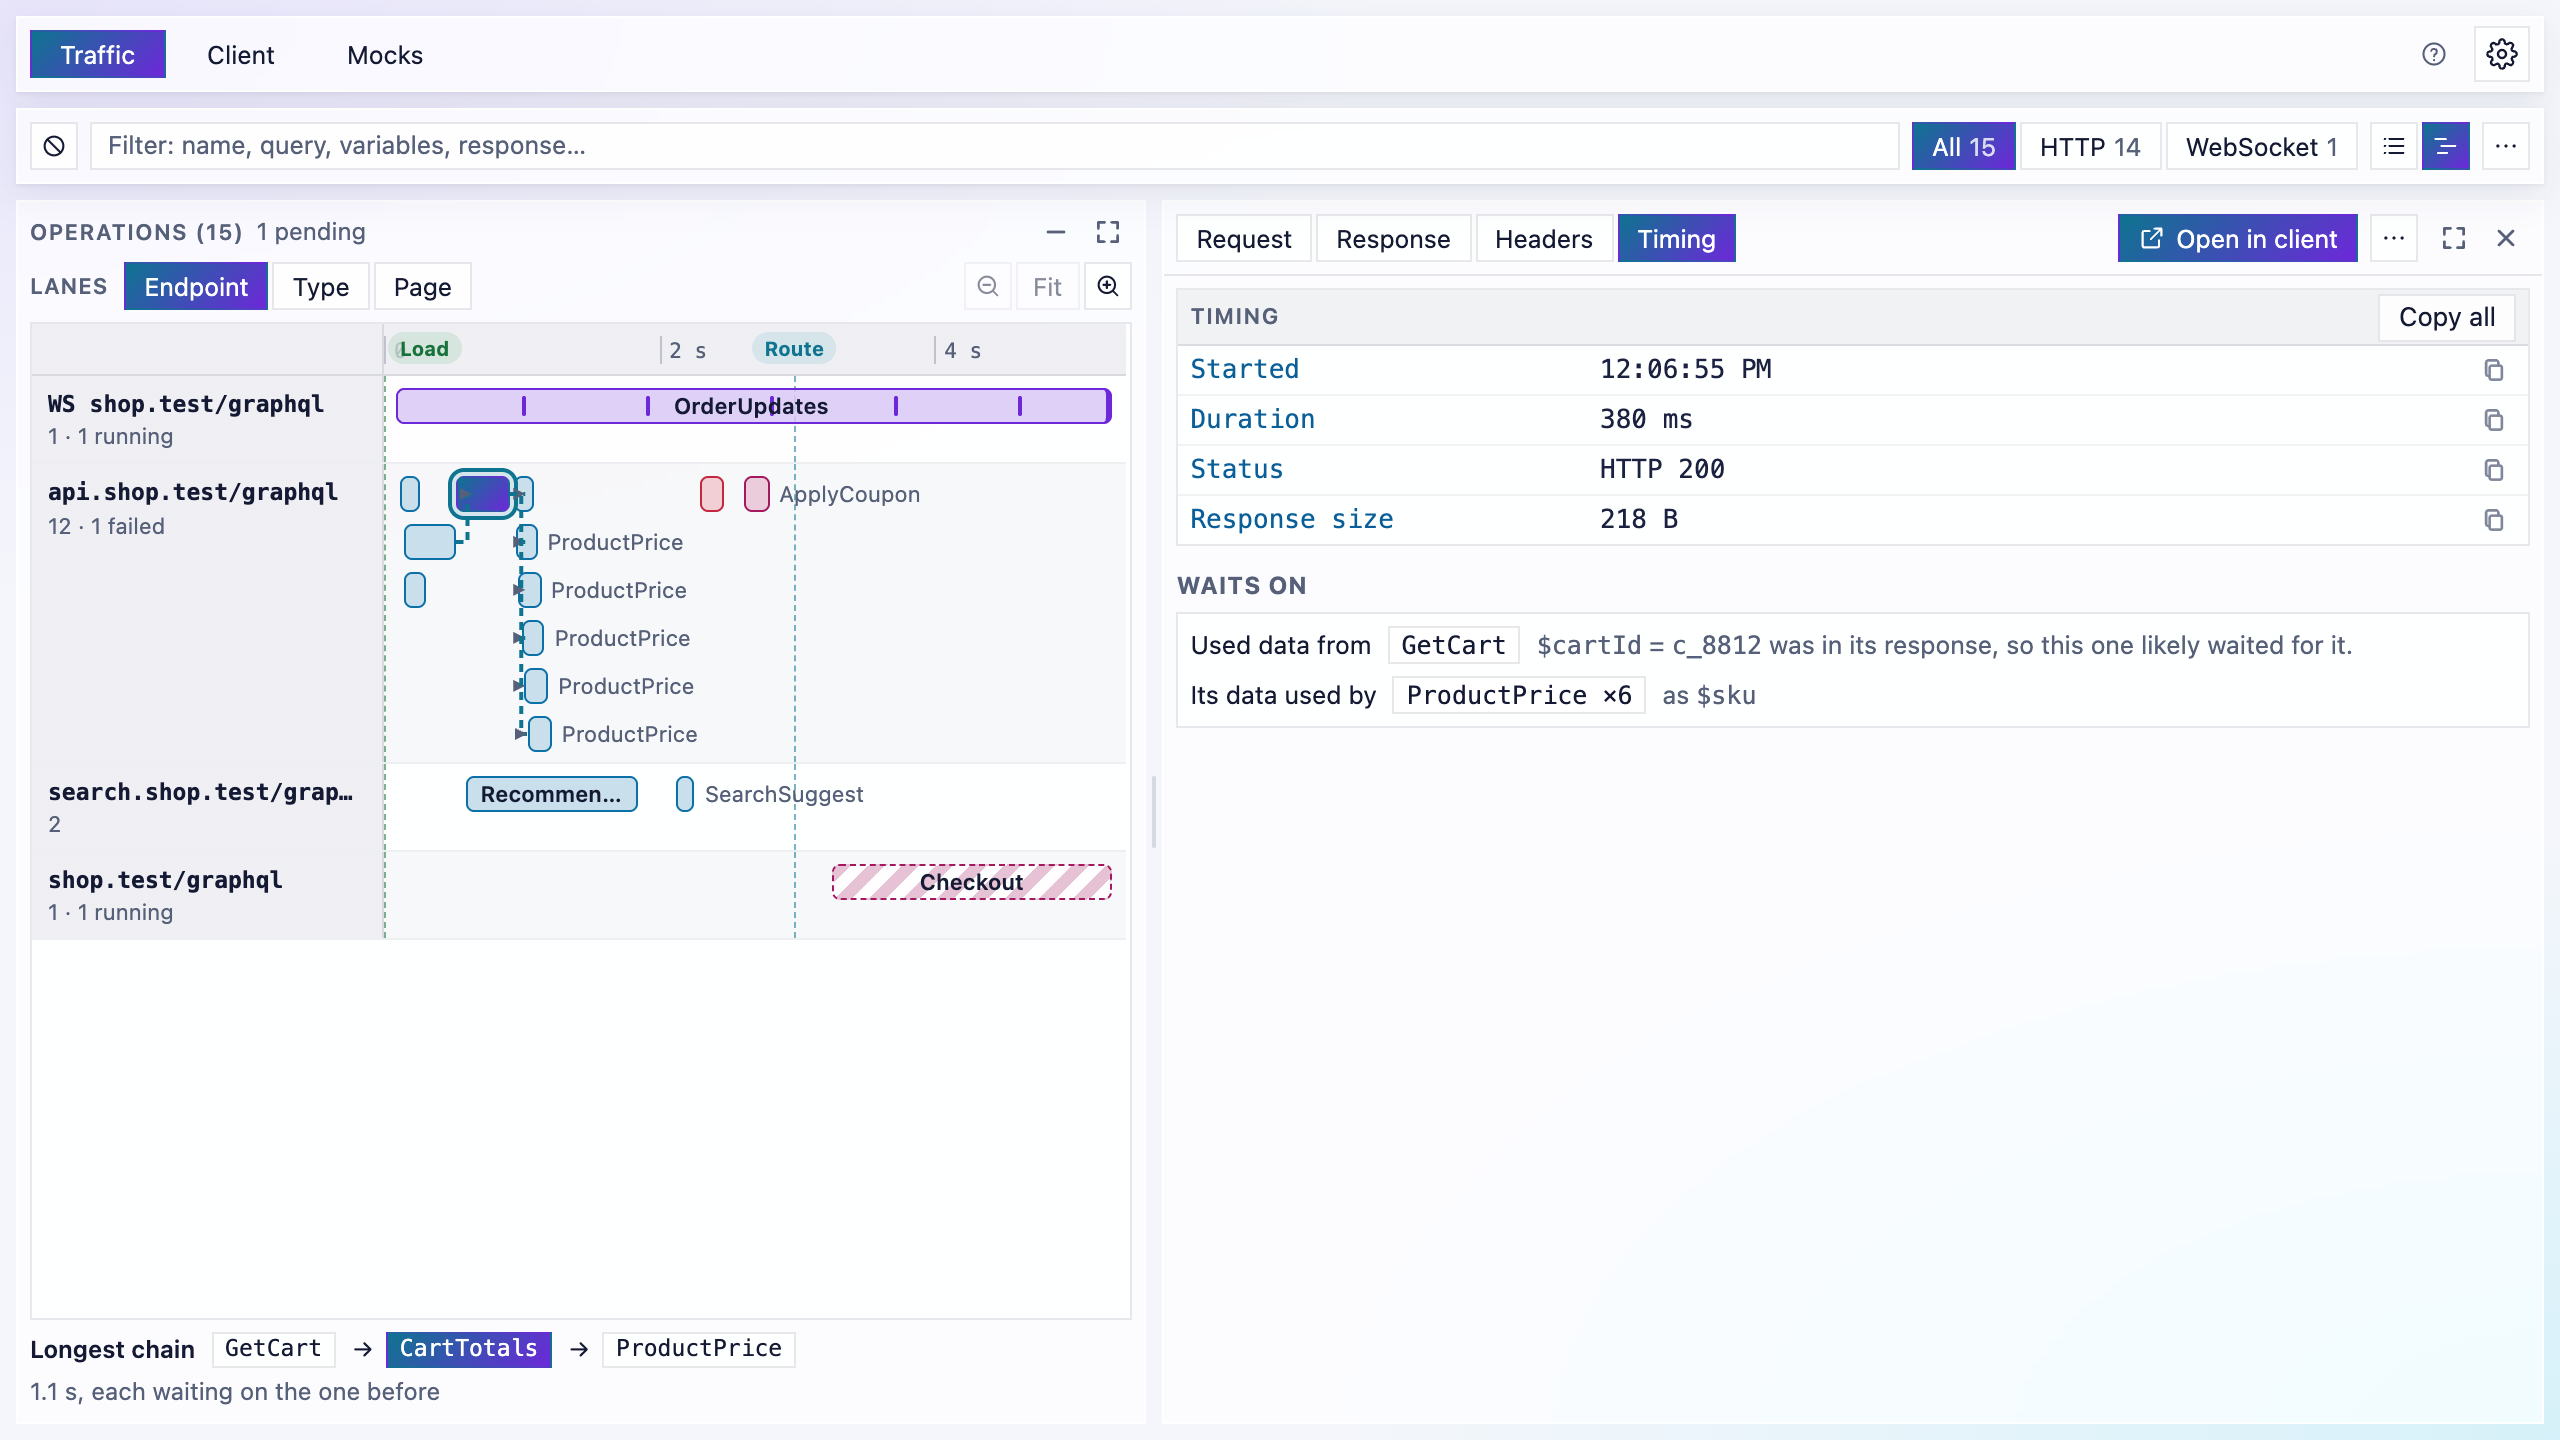
Open it
Section titled “Open it”In Traffic, choose Timeline (the second icon after All / HTTP / WebSocket), or run Switch between list and timeline from the command palette. List goes back. Your choice and the lanes are remembered.
The filter, All / HTTP / WebSocket and the ⋯ options apply to the timeline too, and selecting a bar opens the same detail pane as a row in the list.
Pick what each lane holds with Lanes:
- Endpoint: one lane per GraphQL endpoint, WebSocket endpoints apart (
WS api.example.com/graphql). - Type: queries, mutations and subscriptions.
- Page: one lane per page load or route change, so you can see what each screen asked for.
Each lane says how many operations it holds, how many failed and how many are still running. Operations that overlap in time stack in a lane, so a burst of parallel requests is tall and a run of the same call, one after another, makes a staircase: often an N+1.
Each operation is a bar from the moment it started to the moment it finished, colored by type. Point at a bar for its name, type, status, duration and start time.
- Red: an error (a GraphQL error without data, an HTTP error, or no response).
- Striped and growing: a request still in flight.
- A subscription is one bar for as long as it runs, with a tick for each message it receives.
Load and Route marks show the page loads and app route changes, even with Preserve log on, which keeps the operations of earlier pages on the same timeline.
Which operation waited on which
Section titled “Which operation waited on which”A dashed line joins an operation to the earlier one it most likely waited for: one of its variable values, such as an id or a token, was in that operation’s response. The selected bar’s lines are highlighted. The Timing section names them: Used data from (with the variable and its value) and Its data used by (repeats are counted, as in ProductPrice ×6). Click a name to select it.
Under the lanes, Longest chain names the longest run of operations that each waited on the one before, and how long it took from the first start to the last finish. That chain is often what to make faster, or to fetch in one request.
These links are found by matching values, not read from the page’s code: a value that happens to appear in an unrelated response can link two operations that don’t depend on each other. Short values and booleans are never matched.
Zoom and move
Section titled “Zoom and move”- Zoom in and Zoom out, or Ctrl/Cmd + scroll over the timeline, zoom around the pointer; scroll sideways to move. Fit shows everything again.
- While zoomed in, Follow keeps the newest operations in view. Scrolling back turns it off; scrolling to the end turns it on again.
- With a bar focused, ← and → select the previous or next operation in time.
© 2026 Melliforge. All rights reserved.